

Causal Discovery from Subsampled Time Series Data by Constraint Optimization
- PMID: 28203316
- PMCID: PMC5305170
Causal Discovery from Subsampled Time Series Data by Constraint Optimization
Abstract
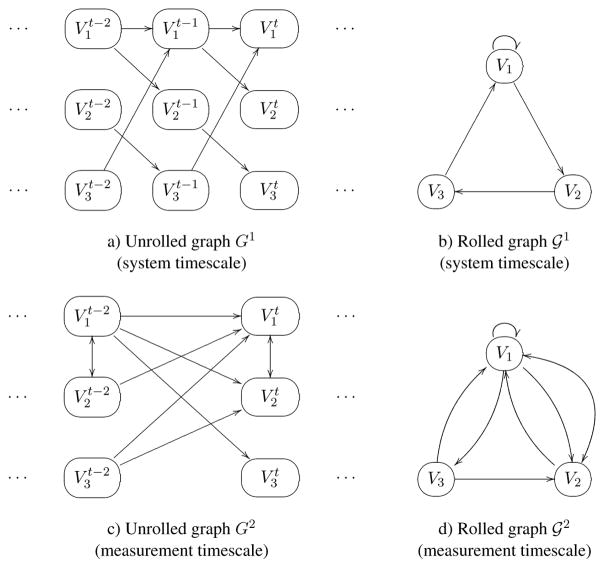
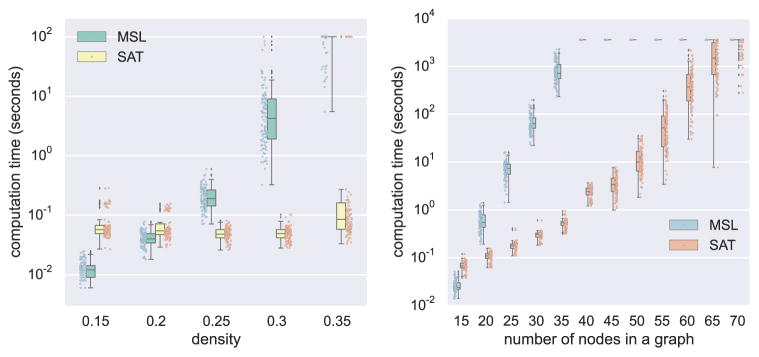
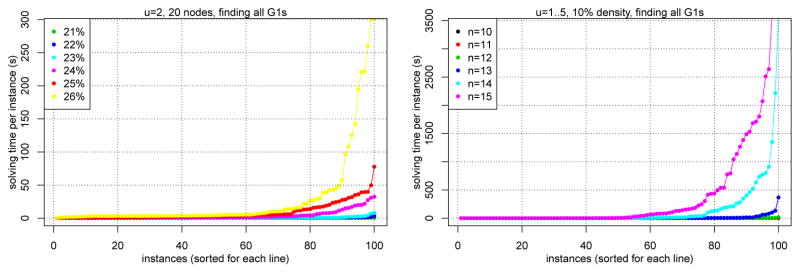
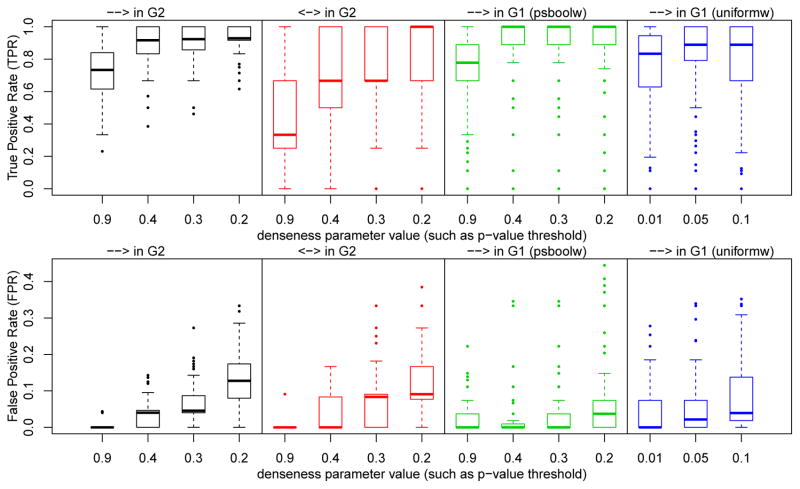
This paper focuses on causal structure estimation from time series data in which measurements are obtained at a coarser timescale than the causal timescale of the underlying system. Previous work has shown that such subsampling can lead to significant errors about the system's causal structure if not properly taken into account. In this paper, we first consider the search for the system timescale causal structures that correspond to a given measurement timescale structure. We provide a constraint satisfaction procedure whose computational performance is several orders of magnitude better than previous approaches. We then consider finite-sample data as input, and propose the first constraint optimization approach for recovering the system timescale causal structure. This algorithm optimally recovers from possible conflicts due to statistical errors. More generally, these advances allow for a robust and non-parametric estimation of system timescale causal structures from subsampled time series data.
Keywords: causal discovery; causality; constraint optimization; constraint satisfaction; graphical models; time series.
Figures
References
-
- Biere A, Heule M, van Maaren H, Walsh T, editors. Handbook of Satisfiability, volume 185 of FAIA. IOS Press; 2009.
-
- Danks D, Plis S. Learning causal structure from undersampled time series. NIPS 2013 Workshop on Causality; 2013.
-
- Dash D, Druzdzel M. Proc EC-SQARU, volume 2143 of LNCS. Springer; 2001. Caveats for causal reasoning with equilibrium models; pp. 192–203.
-
- Entner D, Hoyer P. On causal discovery from time series data using FCI. Proc PGM. 2010:121–128.
-
- Gebser M, Kaufmann B, Kaminski R, Ostrowski M, Schaub T, Schneider M. Potassco: The Potsdam answer set solving collection. AI Communications. 2011;24(2):107–124.
Grants and funding
LinkOut - more resources
Full Text Sources