

Long Non-coding RNA H19 Induces Cerebral Ischemia Reperfusion Injury via Activation of Autophagy
- PMID: 28203482
- PMCID: PMC5287389
- DOI: 10.14336/AD.2016.0530
Long Non-coding RNA H19 Induces Cerebral Ischemia Reperfusion Injury via Activation of Autophagy
Abstract
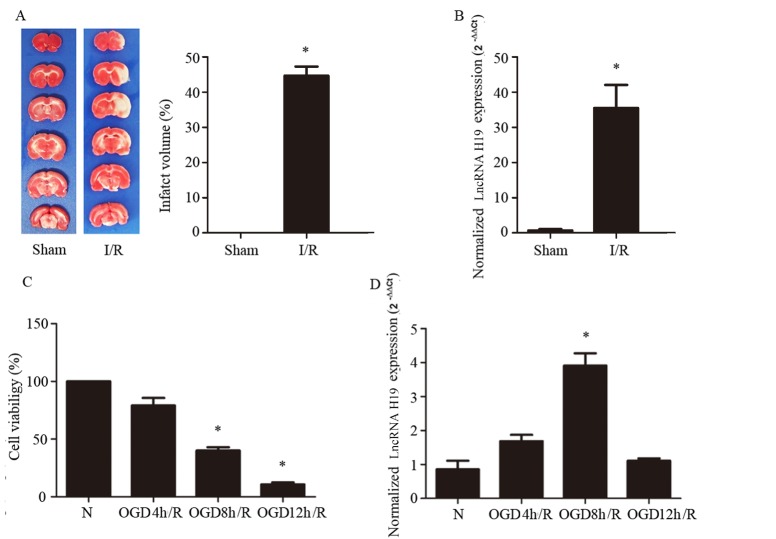
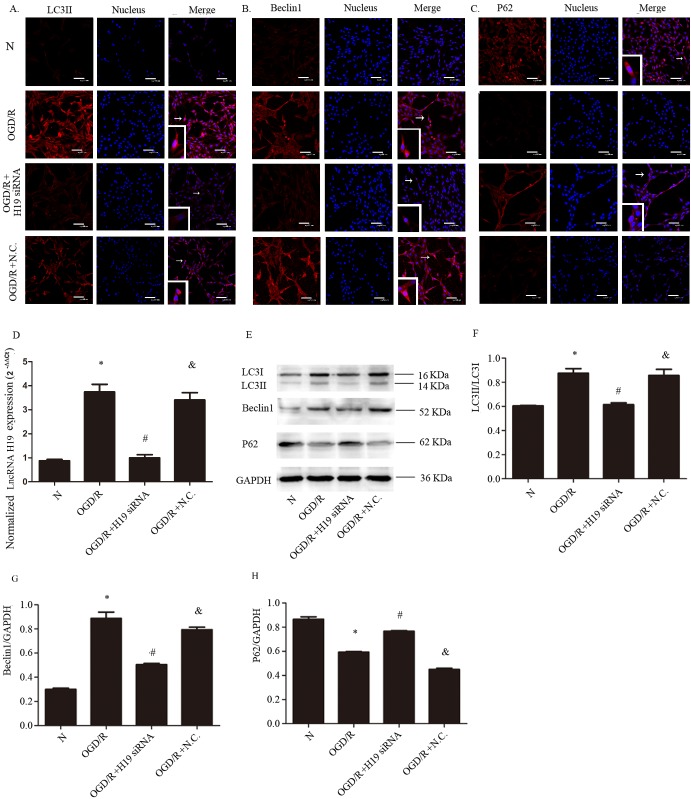
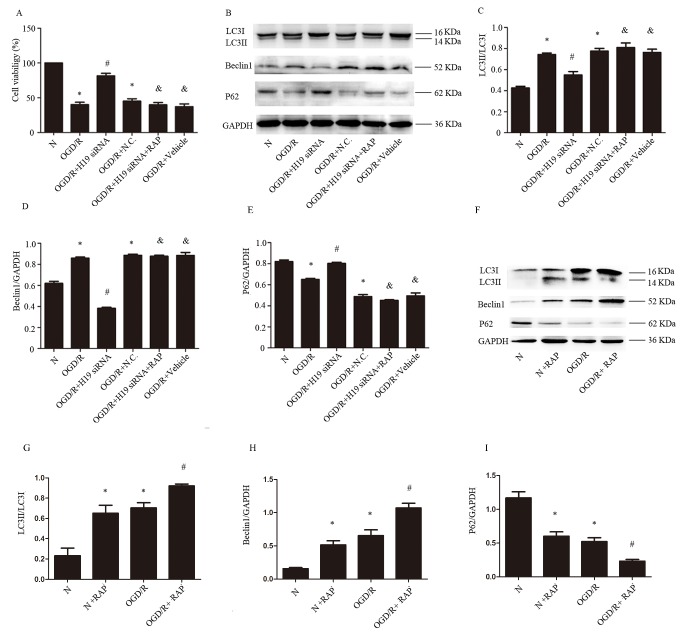
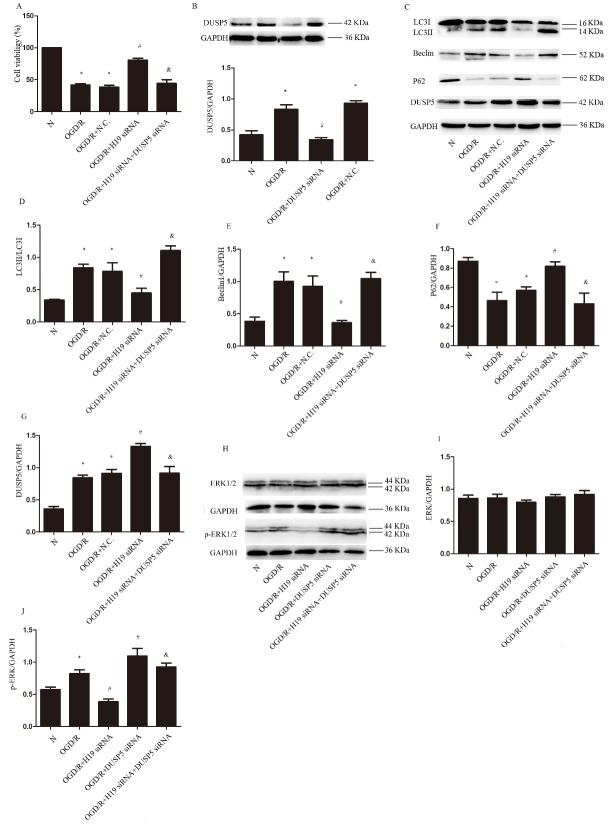
Long non-coding RNA H19 (lncRNA H19) was found to be upregulated by hypoxia, its expression and function have never been tested in cerebral ischemia and reperfusion (I/R) injury. This study intended to investigate the role of lncRNA H19 and H19 gene variation in cerebral I/R injury with focusing on its relationship with autophagy activation. Cerebral I/R was induced in rats by middle cerebral artery occlusion followed by reperfusion. SH-SY5Y cells were subjected to oxygen and glucose deprivation and reperfusion (OGD/R) to simulate I/R injury. Real-time PCR, flow cytometry, immunofluorescence and Western blot were used to evaluate the level of lncRNA H19, apoptosis, autophagy and some related proteins. The modified multiple ligase reaction was used to analyze the gene polymorphism of six SNPs in H19, rs217727, rs2067051, rs2251375, rs492994, rs2839698 and rs10732516 in ischemic stroke patients. We found that the expression of lncRNA H19 was upregulated by cerebral I/R in rats, as well as by OGD/R in vitro in the cells. Inhibition of lncRNA H19 and autophagy protected cells from OGD/R-induced death, respectively. Autophagy activation induced by OGD/R was prevented by H19 siRNA. Autophagy inducer, rapamycin, abolished lncRNA H19 effect. Furthermore, we found that lncRNA H19 inhibited autophagy through DUSP5-ERK1/2 axis. The result from blood samples of ischemic patients revealed that the variation of H19 gene increased the risk of ischemic stroke. Taken together, the results of present study suggest that LncRNA H19 could be a new therapeutic target of ischemic stroke.
Keywords: apoptosis; autophagy; cerebral ischemia reperfusion; gene polymorphism; lncRNA H19.
Figures

Similar articles
-
LncRNA SNHG12 as a potent autophagy inducer exerts neuroprotective effects against cerebral ischemia/reperfusion injury.Biochem Biophys Res Commun. 2019 Jun 25;514(2):490-496. doi: 10.1016/j.bbrc.2019.04.158. Epub 2019 May 2. Biochem Biophys Res Commun. 2019. PMID: 31056262
-
Metformin Protects against Oxidative Stress Injury Induced by Ischemia/Reperfusion via Regulation of the lncRNA-H19/miR-148a-3p/Rock2 Axis.Oxid Med Cell Longev. 2019 Dec 16;2019:8768327. doi: 10.1155/2019/8768327. eCollection 2019. Oxid Med Cell Longev. 2019. PMID: 31934270 Free PMC article.
-
Overexpression of long non-coding RNA SNHG16 against cerebral ischemia-reperfusion injury through miR-106b-5p/LIMK1 axis.Life Sci. 2020 Aug 1;254:117778. doi: 10.1016/j.lfs.2020.117778. Epub 2020 May 11. Life Sci. 2020. PMID: 32407850
-
Long non-coding RNA H19: Physiological functions and involvements in central nervous system disorders.Neurochem Int. 2021 Sep;148:105072. doi: 10.1016/j.neuint.2021.105072. Epub 2021 May 28. Neurochem Int. 2021. PMID: 34058282 Review.
-
The role of lncRNA H19 in tumorigenesis and drug resistance of human Cancers.Front Genet. 2022 Sep 27;13:1005522. doi: 10.3389/fgene.2022.1005522. eCollection 2022. Front Genet. 2022. PMID: 36246634 Free PMC article. Review.
Cited by
-
Protective Effects of Adrenomedullin on Rat Cerebral Tissue After Transient Bilateral Common Carotid Artery Occlusion and Reperfusion.Braz J Cardiovasc Surg. 2020 Jun 1;35(3):314-322. doi: 10.21470/1678-9741-2019-0059. Braz J Cardiovasc Surg. 2020. PMID: 32549103 Free PMC article.
-
New epigenetic players in stroke pathogenesis: From non-coding RNAs to exosomal non-coding RNAs.Biomed Pharmacother. 2021 Aug;140:111753. doi: 10.1016/j.biopha.2021.111753. Epub 2021 May 25. Biomed Pharmacother. 2021. PMID: 34044272 Free PMC article. Review.
-
Naringin Targets NFKB1 to Alleviate Oxygen-Glucose Deprivation/Reoxygenation-Induced Injury in PC12 Cells Via Modulating HIF-1α/AKT/mTOR-Signaling Pathway.J Mol Neurosci. 2021 Jan;71(1):101-111. doi: 10.1007/s12031-020-01630-8. Epub 2020 Jun 18. J Mol Neurosci. 2021. PMID: 32557145
-
HBO Alleviates Neural Stem Cell Pyroptosis via lncRNA-H19/miR-423-5p/NLRP3 Axis and Improves Neurogenesis after Oxygen Glucose Deprivation.Oxid Med Cell Longev. 2022 Feb 7;2022:9030771. doi: 10.1155/2022/9030771. eCollection 2022. Oxid Med Cell Longev. 2022. PMID: 35178162 Free PMC article.
-
Blocking lncRNA H19-miR-19a-Id2 axis attenuates hypoxia/ischemia induced neuronal injury.Aging (Albany NY). 2019 Jun 5;11(11):3585-3600. doi: 10.18632/aging.101999. Aging (Albany NY). 2019. PMID: 31170091 Free PMC article.
References
-
- Mozaffarian D, Benjamin EJ, Go AS, et al. (2016). Executive Summary: Heart Disease and Stroke Statistics-2016 Update: A report from the American Heart Association. Circulation, 133: 447-54. - PubMed
-
- Amouyel P (2012). From genes to stroke subtypes. Lancet Neurol, 11: 931-3. - PubMed
-
- Shi X, Sun M, Liu H, Yao Y, Song Y (2013). Long non-coding RNAs: a new frontier in the study of human diseases. Cancer Lett, 339: 159-66. - PubMed
-
- Gabory A, Jammes H, Dandolo L (2010). The H19 locus: role of an imprinted non-coding RNA in growth and development. Bioessays, 32: 473-80. - PubMed
LinkOut - more resources
Full Text Sources
Other Literature Sources
Miscellaneous