

Defining age- and lactocrine-sensitive elements of the neonatal porcine uterine microRNA-mRNA interactome
- PMID: 28203709
- PMCID: PMC5819844
- DOI: 10.1093/biolre/iox001
Defining age- and lactocrine-sensitive elements of the neonatal porcine uterine microRNA-mRNA interactome
Abstract
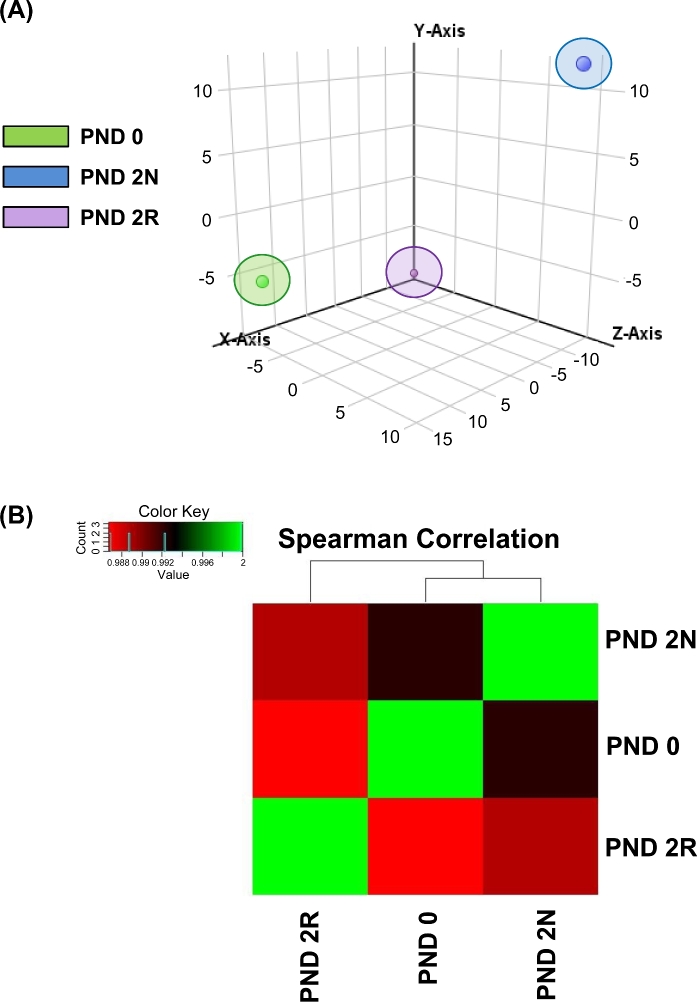
Factors delivered to offspring in colostrum within 2 days of birth support neonatal porcine uterine development. The uterine mRNA transcriptome is affected by age and nursing during this period. Whether uterine microRNA (miRNA) expression is affected similarly is unknown. Objectives were to (1) determine effects of age and nursing on porcine uterine miRNA expression between birth and postnatal day (PND) 2 using miRNA sequencing (miRNAseq) and; (2) define affected miRNA–mRNA interactions and associated biological processes using integrated target prediction analysis. At birth (PND 0), gilts were euthanized, nursed ad libitum, or gavage-fed milk replacer for 48 h. Uteri were collected at birth or 50 h postnatal. MicroRNAseq data were validated using quantitative real-time PCR. Targets were predicted using an established mRNA database generated from the same tissues. For PND 2 versus PND 0 comparisons, 31 differentially expressed (DE) miRNAs were identified for nursed, and 42 DE miRNAs were identified for replacer-fed gilts. Six DE miRNAs were identified for nursed versus replacer-fed gilts on PND 2. Target prediction for inversely correlated DE miRNA–mRNA pairings indicated 20 miRNAs targeting 251 mRNAs in nursed, versus 29 miRNAs targeting 585 mRNAs in replacer-fed gilts for PND 2 versus PND 0 comparisons, and 5 miRNAs targeting 81 mRNAs for nursed versus replacer-fed gilts on PND 2. Biological processes predicted to be affected by age and nursing included cell-to-cell signaling, cell morphology, and tissue morphology. Results indicate novel age- and lactocrine-sensitive miRNA–mRNA relationships associated with porcine neonatal uterine development between birth and PND 2
Keywords: neonate; uterus; pig; microRNA; transcriptome; lactocrine.
Figures


Similar articles
-
Milk-borne lactocrine-acting factors affect gene expression patterns in the developing neonatal porcine uterus.Reproduction. 2011 May;141(5):675-83. doi: 10.1530/REP-10-0320. Epub 2011 Feb 11. Reproduction. 2011. PMID: 21317299
-
Age and Nursing Affect the Neonatal Porcine Uterine Transcriptome.Biol Reprod. 2016 Feb;94(2):46. doi: 10.1095/biolreprod.115.136150. Epub 2015 Dec 2. Biol Reprod. 2016. PMID: 26632611
-
PHYSIOLOGY AND ENDOCRINOLOGY SYMPOSIUM: Postnatal reproductive development and the lactocrine hypothesis.J Anim Sci. 2017 May;95(5):2200-2210. doi: 10.2527/jas.2016.1144. J Anim Sci. 2017. PMID: 28727004 Review.
-
Nursing for 48 hours from birth supports porcine uterine gland development and endometrial cell compartment-specific gene expression.Biol Reprod. 2013 Jan 3;88(1):4. doi: 10.1095/biolreprod.112.105056. Print 2013 Jan. Biol Reprod. 2013. PMID: 23136302
-
Lactation Biology Symposium: lactocrine signaling and developmental programming.J Anim Sci. 2013 Feb;91(2):696-705. doi: 10.2527/jas.2012-5764. Epub 2012 Oct 16. J Anim Sci. 2013. PMID: 23100582 Review.
References
-
- Yan W, Wiley AA, Bathgate RA, Frankshun AL, Lasano S, Crean BD, Steinetz BG, Bagnell CA, Bartol FF. Expression of LGR7 and LGR8 by neonatal porcine uterine tissues and transmission of milk-borne relaxin into the neonatal circulation by suckling. Endocrinology, 2006, 147:4303–4310. - PubMed
-
- Bartol FF, Wiley AA, Bagnell CA. Epigenetic programming of porcine endometrial function and the lactocrine hypothesis. Reprod Domest Anim, 2008, 43, (Suppl 2):273–279. - PubMed
-
- Miller DJ, Wiley AA, Chen JC, Bagnell CA, Bartol FF. Nursing for 48 hours from birth supports porcine uterine gland development and endometrial cell compartment-specific gene expression. Biol Reprod, 2013, 88:4. - PubMed
-
- Vallet JL, Miles JR, Rempel LA. A simple novel measure of passive transfer of maternal immunoglobulin is predictive of preweaning mortality in piglets. Vet J, 2013, 195:91–97. - PubMed
MeSH terms
Substances
LinkOut - more resources
Full Text Sources
Other Literature Sources
Medical
Molecular Biology Databases
