. 2017 Aug 1;19(8):1097-1108.
doi: 10.1093/neuonc/now304.

The clinical value of patient-derived glioblastoma tumorspheres in predicting treatment response

Affiliations

The clinical value of patient-derived glioblastoma tumorspheres in predicting treatment response

Quintino Giorgio D'Alessandris et al. Neuro Oncol. .

Abstract

Background: Advances from glioma stemlike cell (GSC) research, though increasing our knowledge of glioblastoma (GBM) biology, do not influence clinical decisions yet. We explored the translational power of GSC-enriched cultures from patient-derived tumorspheres (TS) in predicting treatment response.

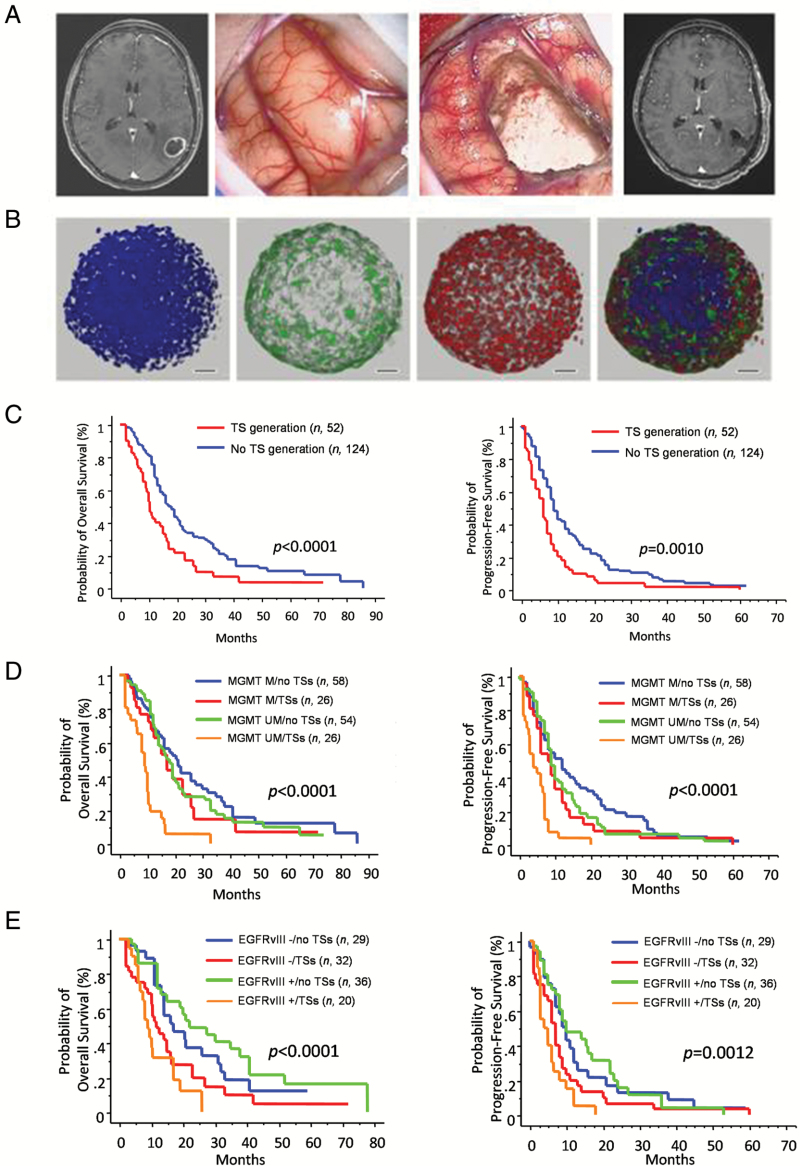
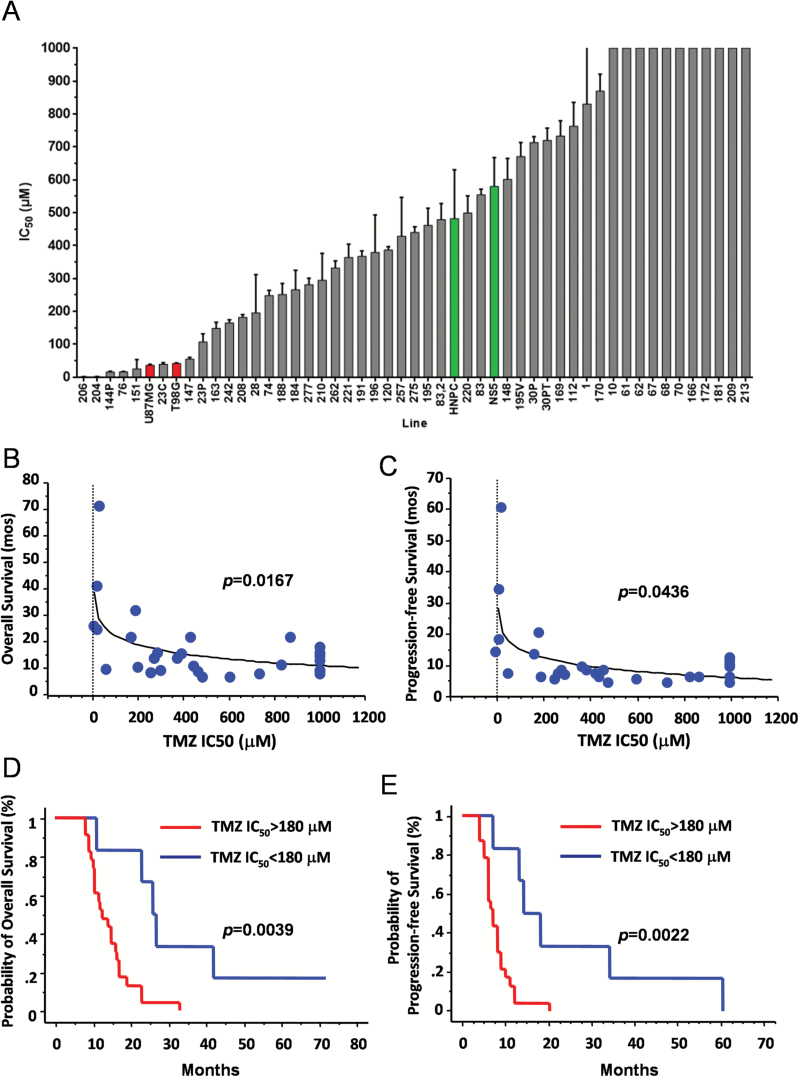
Methods: The relationship between TS growth and clinical outcome was investigated in 52 GBMs treated with surgical resection followed by radiotherapy and temozolomide (TMZ). The effect on TS of radiation (6 to 60 Gy) and of TMZ (3.9 μM to 1 mM) was related with patients' survival.

Results: Generation of TS was an independent factor for poor overall survival (OS) and poor progression-free survival (PFS) (P < .0001 and P = .0010, respectively). Growth rate and clonogenicity of TS predicted poor OS. In general, TS were highly resistant to both radiation and TMZ. Resistance to TMZ was stronger in TS with high clonogenicity and fast growth (P < .02). Shorter PFS was associated with radiation LD50 (lethal dose required to kill 50% of TS cells) >12 Gy of matched TS (P = .0484). A direct relationship was found between sensitivity of TS to TMZ and patients' survival (P = .0167 and P = .0436 for OS and PFS, respectively). Importantly, values for TMZ half-maximal inhibitory concentration <50 μM, which are in the range of plasma levels achieved in vivo, identified cases with longer OS and PFS (P = .0020 and P = .0016, respectively).

Conclusions: Analysis of TS holds translational relevance by predicting the response of parent tumors to radiation and, particularly, to TMZ. Dissecting the clonogenic population from proliferating progeny in TS can guide therapeutic strategies to a more effective drug selection and treatment duration.

Keywords: cancer stem cells; glioblastoma; radiotherapy; temozolomide; treatment outcome.


Figures

Fig. 1
Fig. 1
(A) Preoperative MR image showing a left temporal tumor (left panel). Intraoperative views before (center left panel) and after (center right panel) tumor removal. Postoperative (48 h) MR image (right panel). (B) Confocal immunofluorescence of TS expressing both stemness-related genes (Sox2, red) and differentiation markers (glial fibrillary acidic protein [GFAP], green). Nuclei stained with 4′,6′-diamidino-2-phenylindole (DAPI) (blue). Scale bars, 50 μm. (C–E) Kaplan–Meier graphs for OS and PFS of GBM patients according to TS generation (n = 176; C); TS generation combined with MGMT promoter methylation (MGMT methylated [M] vs MGMT unmethylated [UM]; D); TS generation combined with EGFRvIII expression (EGFRvIII+ vs EGFRvIII−; E).
Fig. 2
Fig. 2
(A) Kaplan–Meier graphs for OS and PFS of GBM patients according to expansion time of TS (<14 wk vs ≥14 wk). (B) Graph showing OS according to expansion time (<14 wk vs ≥14 wk) and clonogenic index (1.5–8.5 vs >8.5) (** P < .01). (C) Ki67 staining of TS (left panel) in whole mount preparation (upper) and paraffin section (lower). Note the scarcely proliferating core of TS. Bar graph showing average clonogenic and proliferating cells in TS (right panel).
Fig. 3
Fig. 3
(A) Bar graph showing the effect of radiation on 47 TS lines, including 6 lines from 3 patients, at 1 week after exposure to 60 Gy. Gray bars represent radiation doses required to kill 50% of TS cells (LD50). Red bars, LD50 of U87MG and T98G cells; green bars, LD50 of human neural stem cells. Each bar corresponds to the mean of triplicate experiments. Error bars, SD. (B) Bar graph comparing the effect of single-dose and fractionated radiation on a subset of 23 TS. Each bar corresponds to the mean of triplicate experiments. Inset, relationship between LD50 for single-dose and fractionated radiation (R2 = 0.9464; P < .0001). Error bars, SD. (C) Activation state of checkpoint proteins (ATM, ATR, Rad17, Chk1 and Chk2) in sensitive (148, 76, and 83.2) and resistant (67, 70, and 62) TS assessed before (−) and 1 h after (+) 3 Gy radiation. (D, E) Kaplan–Meier graphs for OS (D) and PFS (E) of GBMs according to LD50 of TS (<12 Gy vs ≥12 Gy).
Fig. 4
Fig. 4
(A) Bar graph showing the effect of TMZ at 1 week after exposure to the drug on 47 TS lines, including 8 lines established from 4 patients. Gray bars represent TMZ doses required to kill 50% of TS cells (IC50). Red bars, TMZ IC50 of U87MG and T98G cells; green bars, TMZ IC50 of human neural stem cells. Each bar corresponds to the mean of 3 different experiments. Error bars, SD. (B, C) X-Y graphs plotting the IC50 values to TMZ of TS with the OS (B) and PFS (C) of donor patients. (D, E) Kaplan–Meier graphs for OS (D) and PFS (E) of GBM patients according to TMZ IC50 of matched TS (<180 μM vs ≥180 μM). Analyses in panels B–E were conducted on TS-generating GBMs that completed both concomitant radio-chemotherapy and adjuvant chemotherapy according to Stupp protocol.
Fig. 5
Fig. 5
(A) Graph showing radiation LD50 and TMZ IC50 according to expansion time (<14 wk vs ≥14 wk) and clonogenic index (1.5–8.5 vs ≥8.5) of TS. (**P < .02). (B) X-Y-Z graph plotting radiation LD50 and TMZ IC50 of TS with OS of matched patients.

Similar articles

Cited by

References

    1. Singh SK, Clarke ID, Terasaki M, et al. Identification of a cancer stem cell in human brain tumors. Cancer Res. 2003;63(18):5821–5828. - PubMed
    1. Vermeulen L, de Sousa e Melo F, Richel DJ, Medema JP. The developing cancer stem-cell model: clinical challenges and opportunities. Lancet Oncol. 2012;13(2):e83–e89. - PubMed
    1. Pallini R, Ricci-Vitiani L, Banna GL, et al. Cancer stem cell analysis and clinical outcome in patients with glioblastoma multiforme. Clin Cancer Res. 2008;14(24):8205–8212. - PubMed
    1. Laks DR, Masterman-Smith M, Visnyei K, et al. Neurosphere formation is an independent predictor of clinical outcome in malignant glioma. Stem Cells. 2009;27(4):980–987. - PMC - PubMed
    1. Kong BH, Moon JH, Huh YM, et al. Prognostic value of glioma cancer stem cell isolation in survival of primary glioblastoma patients. Stem Cells Int. 2014;2014:838950. - PMC - PubMed