. 2018 Jan;79(1):71-82.
doi: 10.1002/mrm.26638. Epub 2017 Feb 16.

Multishot echo-planar MREIT for fast imaging of conductivity, current density, and electric field distributions

Affiliations

Multishot echo-planar MREIT for fast imaging of conductivity, current density, and electric field distributions

Munish Chauhan et al. Magn Reson Med. 2018 Jan.

Abstract

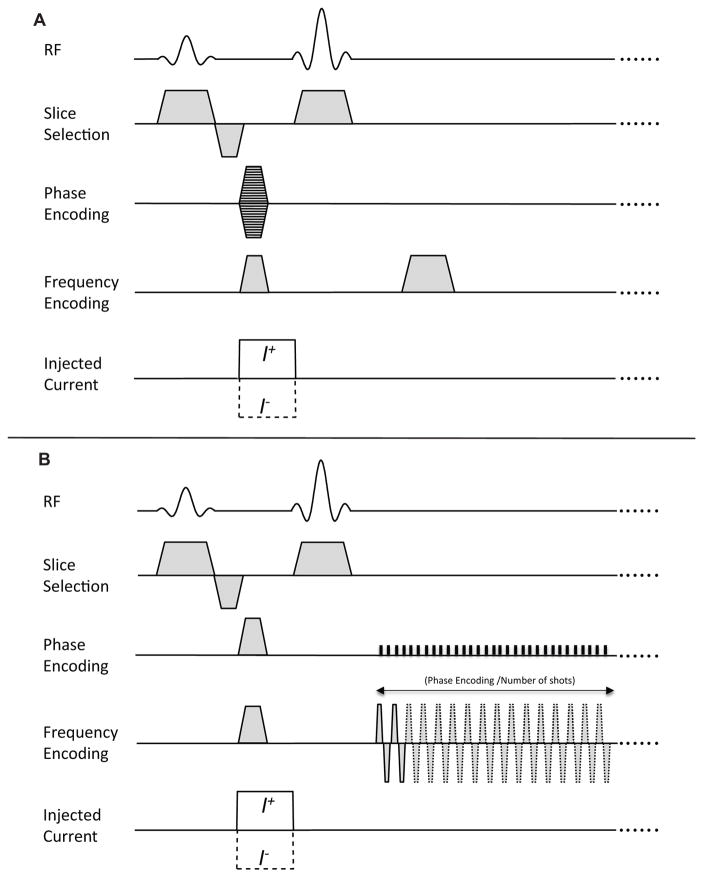
Purpose: Magnetic resonance electrical impedance tomography (MREIT) sequences typically use conventional spin or gradient echo-based acquisition methods for reconstruction of conductivity and current density maps. Use of MREIT in functional and electroporation studies requires higher temporal resolution and faster sequences. Here, single and multishot echo planar imaging (EPI) based MREIT sequences were evaluated to see whether high-quality MREIT phase data could be obtained for rapid reconstruction of current density, conductivity, and electric fields.

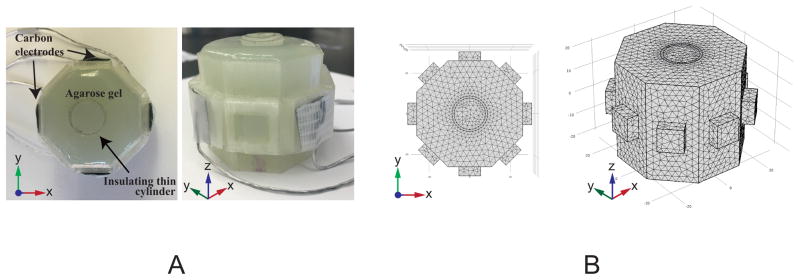
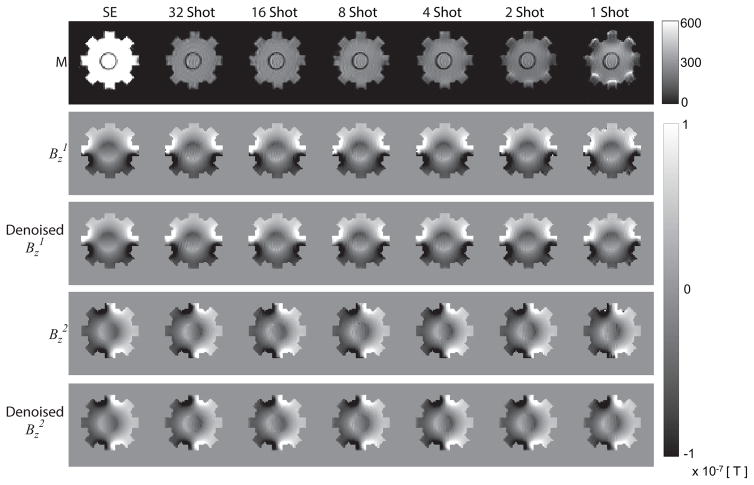
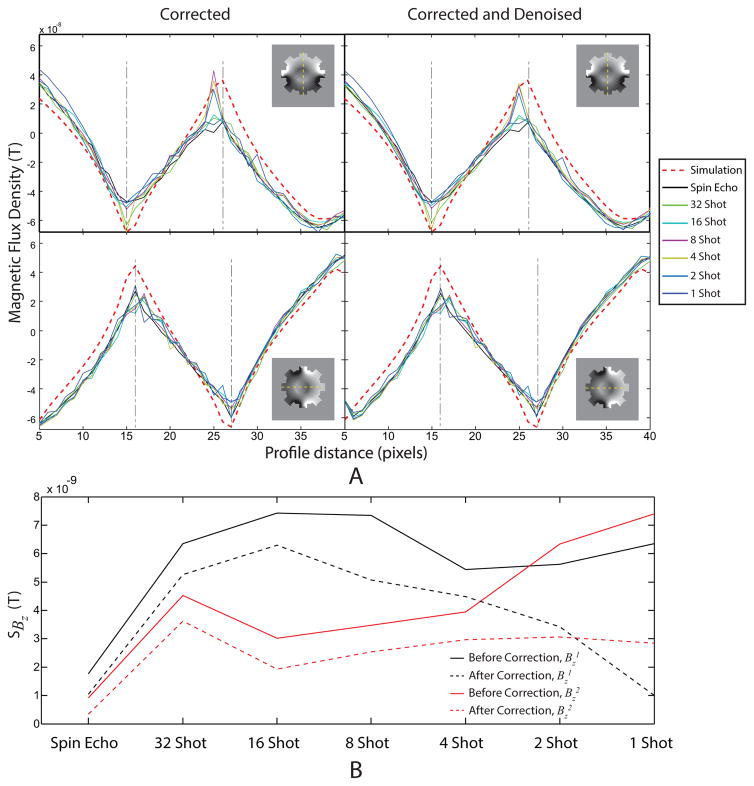
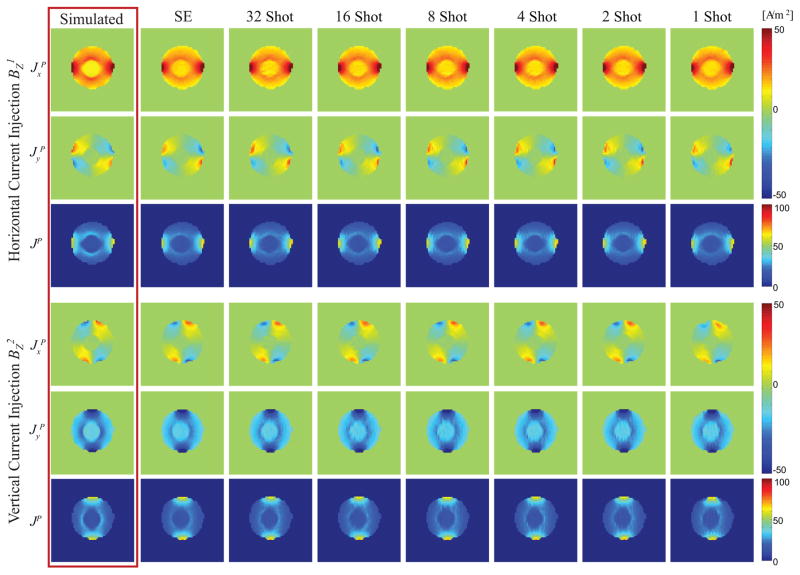
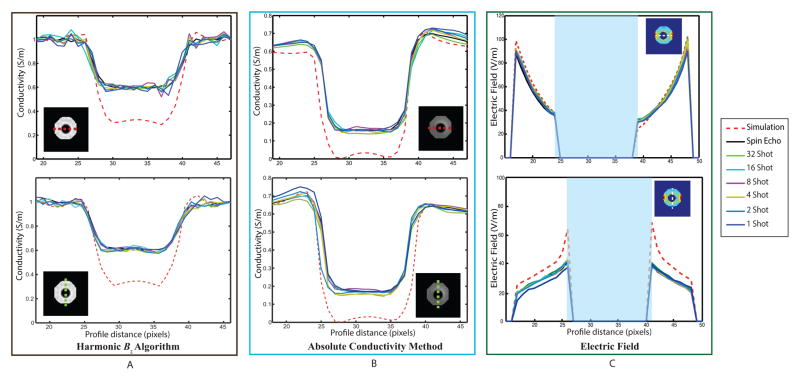
Methods: A gel phantom with an insulating inclusion was used as a test object. Ghost artifact, geometric distortion, and MREIT correction algorithms were applied to the data. The EPI-MREIT-derived phase-projected current density and conductivity images were compared with simulations and spin-echo images as a function of EPI shot number.

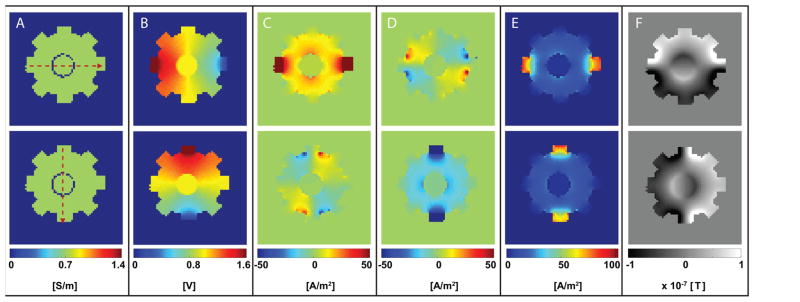
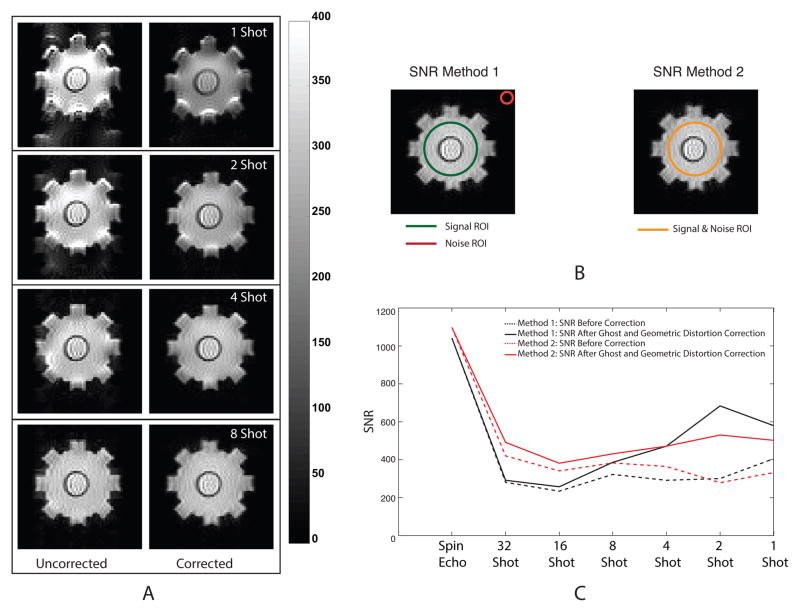
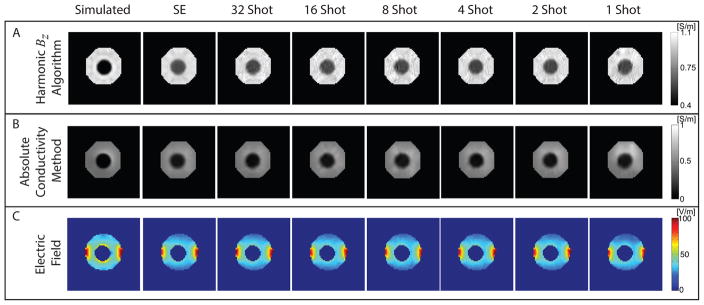
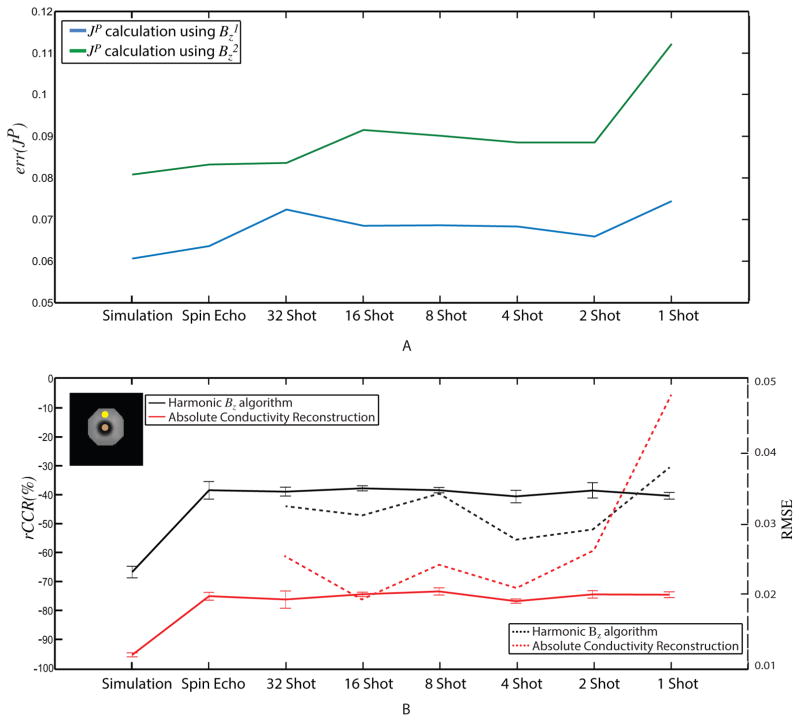
Results: Good agreement among measures in simulated, spin echo, and EPI data was achieved. Current density errors were stable and below 9% as the shot number decreased from 64 to 2, but increased for single-shot images. Conductivity reconstruction relative contrast ratios were stable as the shot number decreased. The derived electric fields also agreed with the simulated data.

Conclusions: The EPI methods can be combined successfully with MREIT reconstruction algorithms to achieve fast imaging of current density, conductivity, and electric field. Magn Reson Med 79:71-82, 2018. © 2017 International Society for Magnetic Resonance in Medicine.

Keywords: EPI; MREIT; conductivity imaging; current density imaging; functional imaging.


Figures

Figure 1
Figure 1
MR pulse sequences for MREIT based on (A) conventional spin echo, and (B) MS SE-EPI. Unipolar imaging currents (I±) were injected in the form of pulses whose timing was synchronized with the RF pulse.
Figure 2
Figure 2
Physical and simulated phantom objects. (A) Experimental phantom: top and oblique views of the gel phantom, and (B) Three-dimensional finite-element model (FEM) mesh of the conductivity phantom (σ = 0.71 Sm−1) showing an insulating cylindrical inclusion placed in the middle of the phantom. Four carbon-hydrogel electrodes were attached on the perimeter of the octagonal surface to inject electric currents into the phantom.
Figure 3
Figure 3
Simulated phantom data produced using finite element model. Images corresponding to horizontal (I1) and vertical (I2) current injections are shown in top and bottom rows, respectively. From left to right, distributions of conductivity (A: σ), voltage (B: V), true current density (C: Jxt, D: Jyt, E: Jzt), and magnetic flux density (F: Bzt) in a central slice with a 10 mA current injection are shown.
Figure 4
Figure 4
Magnitude images and SNR plots for multi-shot images. (A) MR magnitude images of the conductivity phantom before (left column) and after (right column) EPI image correction, (B) ROI for each SNR calculation method, and (C) Comparison of SNR in EPI acquisitions before and after EPI image correction for both methods.
Figure 5
Figure 5
Magnitude and Bz data corresponding to different EPI acquisitions with different levels of correction. Experimental results from acquisitions (Left-Right: Spin Echo, 32-, 16-, 8-, 4-, 2-, and 1-shot SE-EPI) are shown as: Geometric and ghost-corrected (‘corrected’) MR magnitude images (first row), corrected Bz1 (second row), corrected, denoised and in-painted (‘denoised’) Bz1 (third row), corrected Bz2 (fourth row) and corrected and denoised Bz2 (fifth row).
Figure 6
Figure 6
(A) Profiles of experimental Bz data in a slice through the center of the phantom before and after denoising and in-painting (‘denoising’). Data are shown before (left) and after (right) denoising for both horizontal (top) and vertical (bottom) 10 mA current injection. (B) Standard deviations in MREIT data calculated using [10] for Bz1 (black) and Bz2 (red) data both before (solid lines) and after (dashed lines) correction and denoising.
Figure 7
Figure 7
Projected current density distributions ( JxP,JyP, JP) established under horizontal (top panel) and vertical (bottom panel) current injections. Within each row (left to right), the projected current densities displayed were obtained from simulation, spin-echo, 32-, 16-, 8-, 4-, 2-, and 1-shot SE-EPI acquisitions respectively.
Figure 8
Figure 8
Conductivity and electric field distributions reconstructed from corrected and denoised Bz data. (A) Conductivity images reconstructed using the harmonic Bz algorithm, (B) conductivity images reconstructed using the absolute conductivity method, and (C) Projected electric field images calculated for horizontal current injections as a function of shot number. Electric field values inside the anomaly have been masked out.
Figure 9
Figure 9
Vertical and horizontal profile plots of reconstructions. (A) Harmonic Bz algorithm, (B) absolute conductivity method. (C) projected electric field for horizontal current injections. In (C) electric field values inside the anomaly have been masked out.
Figure 10
Figure 10
Errors in projected current density and conductivity as a function of shot number. (A) L2 error in recovered JP from horizontal (blue) and vertical (green) currents. (B) The relative conductivity contrast ratio (rCCR) in Harmonic Bz (black) and Absolute conductivity reconstructions (red) are shown on the left vertical axis. Calculated conductivity RMSE plots are shown on the right vertical axis. ROIs used in computing mean and standard deviations in rCCR measures are shown in the inset image (top left).

References

    1. Woo EJ, Seo JK. Magnetic resonance electrical impedance tomography (MREIT) for high-resolution conductivity imaging. Physiological Measurement. 2008;29:R1–R26. - PubMed
    1. Meng Z, Sajib SZK, Chauhan M, Jeong WC, Kim YT, Kim HJ, JWE Improved conductivity image of human lower extremity using MREIT with chemical shift artifact correction. Biomedical Engineering Letters. 2011;2:62–68.
    1. Kasinadhuni AK, Chauhan M, Indahlastari A, Anderson C, Carney P, Mareci TH, Sadleir RJ. Mapping magnetic fields due to electrical stimulation in the human brain: First Measurements. Vol. 2016. Singapore: International Society for Magnetic Resonance in Medicine; 2016. May 7–13, pp. 1–4.
    1. Sadleir RJ, Grant SC, Woo EJ. Can high-field MREIT be used to directly detect neural activity? Theoretical Considerations Neuro Image. 2010;52(1):205–216. - PMC - PubMed
    1. Scott GC, Joy MLG, Armstrong RL, Henkelman RM. Sensitivity of magnetic-resonance current-density imaging. Journal of Magnetic Resonance. 1992;97:235–254.