

Multi-site quality and variability analysis of 3D FDG PET segmentations based on phantom and clinical image data
- PMID: 28205306
- PMCID: PMC5834232
- DOI: 10.1002/mp.12041
Multi-site quality and variability analysis of 3D FDG PET segmentations based on phantom and clinical image data
Abstract
Purpose: Radiomics utilizes a large number of image-derived features for quantifying tumor characteristics that can in turn be correlated with response and prognosis. Unfortunately, extraction and analysis of such image-based features is subject to measurement variability and bias. The challenge for radiomics is particularly acute in Positron Emission Tomography (PET) where limited resolution, a high noise component related to the limited stochastic nature of the raw data, and the wide variety of reconstruction options confound quantitative feature metrics. Extracted feature quality is also affected by tumor segmentation methods used to define regions over which to calculate features, making it challenging to produce consistent radiomics analysis results across multiple institutions that use different segmentation algorithms in their PET image analysis. Understanding each element contributing to these inconsistencies in quantitative image feature and metric generation is paramount for ultimate utilization of these methods in multi-institutional trials and clinical oncology decision making.
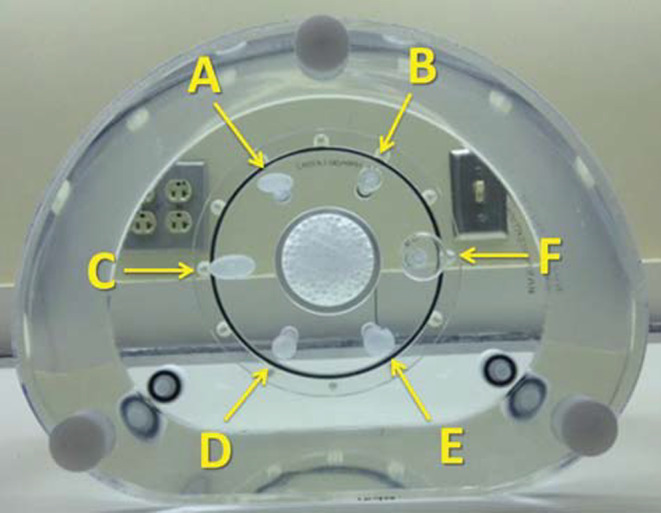
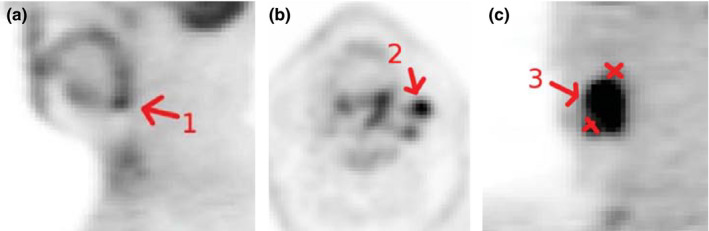
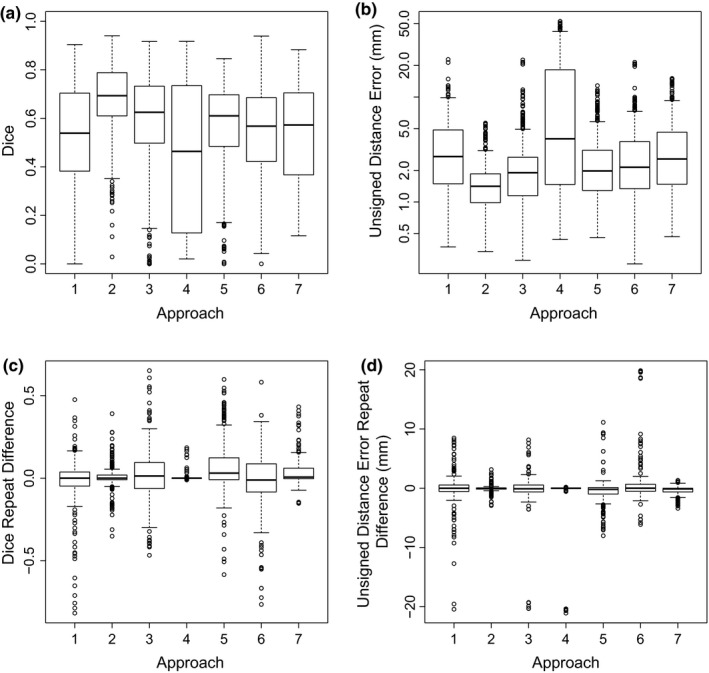
Methods: To assess segmentation quality and consistency at the multi-institutional level, we conducted a study of seven institutional members of the National Cancer Institute Quantitative Imaging Network. For the study, members were asked to segment a common set of phantom PET scans acquired over a range of imaging conditions as well as a second set of head and neck cancer (HNC) PET scans. Segmentations were generated at each institution using their preferred approach. In addition, participants were asked to repeat segmentations with a time interval between initial and repeat segmentation. This procedure resulted in overall 806 phantom insert and 641 lesion segmentations. Subsequently, the volume was computed from the segmentations and compared to the corresponding reference volume by means of statistical analysis.
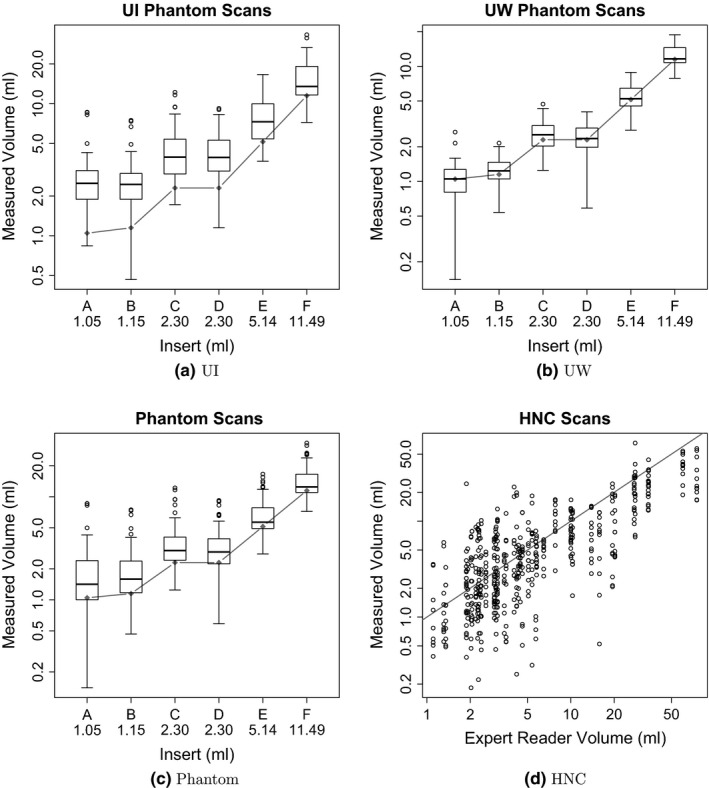
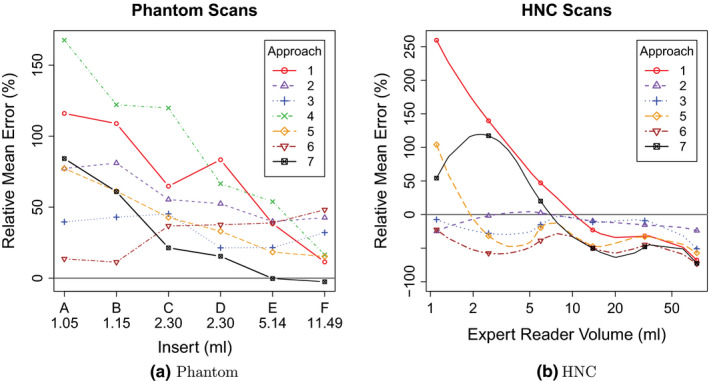
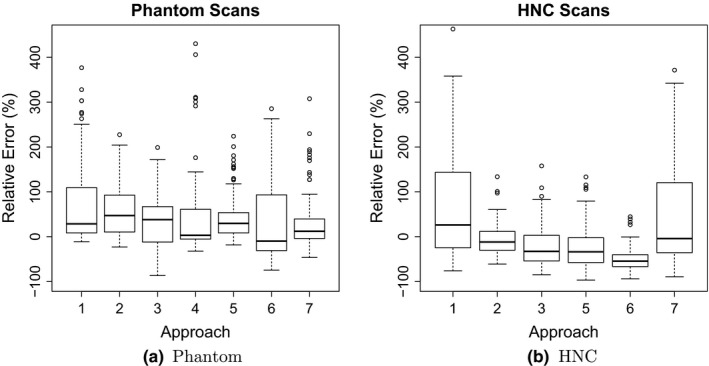
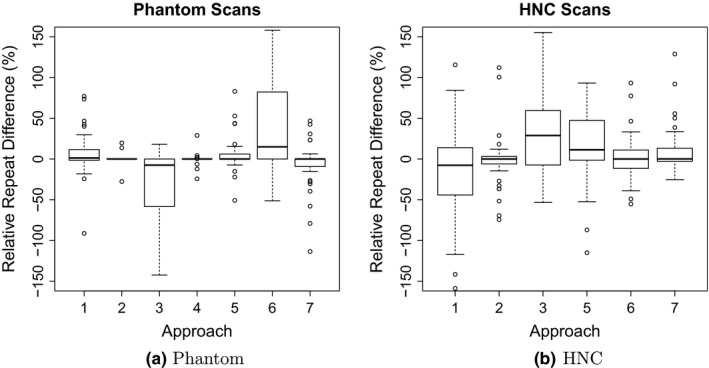
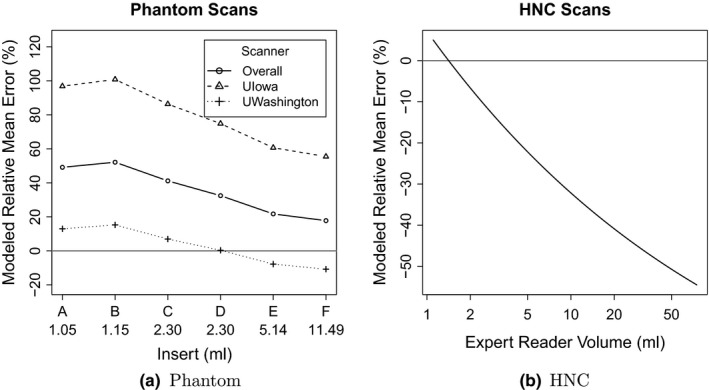
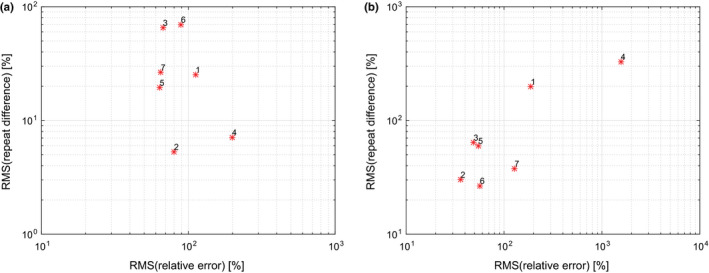
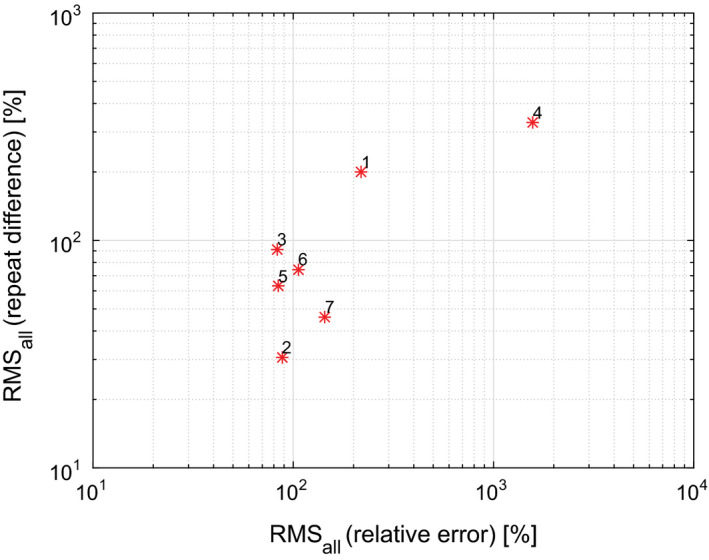
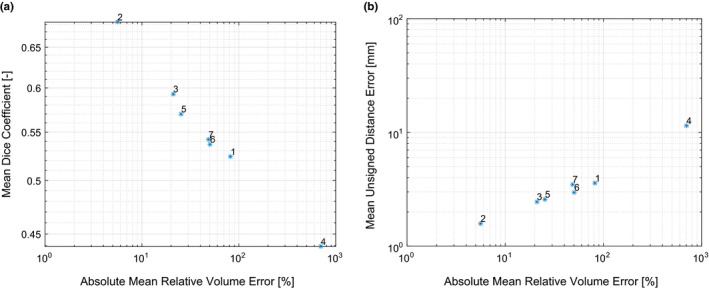
Results: On the two test sets (phantom and HNC PET scans), the performance of the seven segmentation approaches was as follows. On the phantom test set, the mean relative volume errors ranged from 29.9 to 87.8% of the ground truth reference volumes, and the repeat difference for each institution ranged between -36.4 to 39.9%. On the HNC test set, the mean relative volume error ranged between -50.5 to 701.5%, and the repeat difference for each institution ranged between -37.7 to 31.5%. In addition, performance measures per phantom insert/lesion size categories are given in the paper. On phantom data, regression analysis resulted in coefficient of variation (CV) components of 42.5% for scanners, 26.8% for institutional approaches, 21.1% for repeated segmentations, 14.3% for relative contrasts, 5.3% for count statistics (acquisition times), and 0.0% for repeated scans. Analysis showed that the CV components for approaches and repeated segmentations were significantly larger on the HNC test set with increases by 112.7% and 102.4%, respectively.
Conclusion: Analysis results underline the importance of PET scanner reconstruction harmonization and imaging protocol standardization for quantification of lesion volumes. In addition, to enable a distributed multi-site analysis of FDG PET images, harmonization of analysis approaches and operator training in combination with highly automated segmentation methods seems to be advisable. Future work will focus on quantifying the impact of segmentation variation on radiomics system performance.
Keywords: FDG PET; head and neck cancer; multi-site performance analysis; phantom; radiomics; segmentation.
© 2016 American Association of Physicists in Medicine.
Conflict of interest statement
The authors have no conflict of interest to report.
Figures
Similar articles
-
Reproducibility of F18-FDG PET radiomic features for different cervical tumor segmentation methods, gray-level discretization, and reconstruction algorithms.J Appl Clin Med Phys. 2017 Nov;18(6):32-48. doi: 10.1002/acm2.12170. Epub 2017 Sep 11. J Appl Clin Med Phys. 2017. PMID: 28891217 Free PMC article.
-
Fully automated segmentation of oncological PET volumes using a combined multiscale and statistical model.Med Phys. 2007 Feb;34(2):722-36. doi: 10.1118/1.2432404. Med Phys. 2007. PMID: 17388190
-
Phantom validation of coregistration of PET and CT for image-guided radiotherapy.Med Phys. 2004 May;31(5):1083-92. doi: 10.1118/1.1688041. Med Phys. 2004. PMID: 15191296
-
Radiomics: the process and the challenges.Magn Reson Imaging. 2012 Nov;30(9):1234-48. doi: 10.1016/j.mri.2012.06.010. Epub 2012 Aug 13. Magn Reson Imaging. 2012. PMID: 22898692 Free PMC article. Review.
-
Variability and uncertainty of 18F-FDG PET imaging protocols for assessing inflammation in atherosclerosis: suggestions for improvement.J Nucl Med. 2015 Apr;56(4):552-9. doi: 10.2967/jnumed.114.142596. Epub 2015 Feb 26. J Nucl Med. 2015. PMID: 25722452 Review.
Cited by
-
Application of Community Detection Algorithm to Investigate the Correlation between Imaging Biomarkers of Tumor Metabolism, Hypoxia, Cellularity, and Perfusion for Precision Radiotherapy in Head and Neck Squamous Cell Carcinomas.Cancers (Basel). 2021 Aug 3;13(15):3908. doi: 10.3390/cancers13153908. Cancers (Basel). 2021. PMID: 34359810 Free PMC article.
-
Clinical use of positron emission tomography for radiotherapy planning - Medical physics considerations.Z Med Phys. 2023 Feb;33(1):13-21. doi: 10.1016/j.zemedi.2022.09.001. Epub 2022 Oct 20. Z Med Phys. 2023. PMID: 36272949 Free PMC article. Review.
-
Voxel size and gray level normalization of CT radiomic features in lung cancer.Sci Rep. 2018 Jul 12;8(1):10545. doi: 10.1038/s41598-018-28895-9. Sci Rep. 2018. PMID: 30002441 Free PMC article.
-
Quantitative Imaging Informatics for Cancer Research.JCO Clin Cancer Inform. 2020 May;4:444-453. doi: 10.1200/CCI.19.00165. JCO Clin Cancer Inform. 2020. PMID: 32392097 Free PMC article.
-
A Bayesian framework for performance assessment and comparison of imaging biomarker quantification methods.Stat Methods Med Res. 2019 Apr;28(4):1003-1018. doi: 10.1177/0962280217741334. Epub 2017 Dec 22. Stat Methods Med Res. 2019. PMID: 29271301 Free PMC article.
References
-
- Cook GJR, Siddique M, Taylor BP, et al. Radiomics in PET: principles and applications. Clinical and Translational Imaging. 2014;2:269–276.
-
- Sridhar P, Mercier G, Tan J, et al. FDG PET metabolic tumor volume segmentation and pathologic volume of primary human solid tumors. AJR Am J Roentgenol 2014;202(5):1114–1119. - PubMed
-
- Dibble EH, Alvarez AC, Truong MT, et al. 18F‐FDG metabolic tumor volume and total glycolytic activity of oral cavity and oropharyngeal squamous cell cancer: adding value to clinical staging. J Nucl Med. 2012;53:709–715. - PubMed
Publication types
MeSH terms
Substances
Grants and funding
- U24 CA180918/CA/NCI NIH HHS/United States
- P30 CA047904/CA/NCI NIH HHS/United States
- P30 CA086862/CA/NCI NIH HHS/United States
- R50 CA211270/CA/NCI NIH HHS/United States
- U01 CA143062/CA/NCI NIH HHS/United States
- U01 CA148131/CA/NCI NIH HHS/United States
- U01 CA200464/CA/NCI NIH HHS/United States
- P30 CA076292/CA/NCI NIH HHS/United States
- U01 CA140207/CA/NCI NIH HHS/United States
- U01 CA140230/CA/NCI NIH HHS/United States
- U24 CA180927/CA/NCI NIH HHS/United States
- U01 CA157442/CA/NCI NIH HHS/United States
- U01 CA140206/CA/NCI NIH HHS/United States
- R01 CA169072/CA/NCI NIH HHS/United States
- P30 ES005605/ES/NIEHS NIH HHS/United States
LinkOut - more resources
Full Text Sources
Other Literature Sources
