. 2017 Feb 16:8:14455.
doi: 10.1038/ncomms14455.

Cationic amino acid transporters play key roles in the survival and transmission of apicomplexan parasites

Affiliations

Cationic amino acid transporters play key roles in the survival and transmission of apicomplexan parasites

Esther Rajendran et al. Nat Commun. .

Abstract

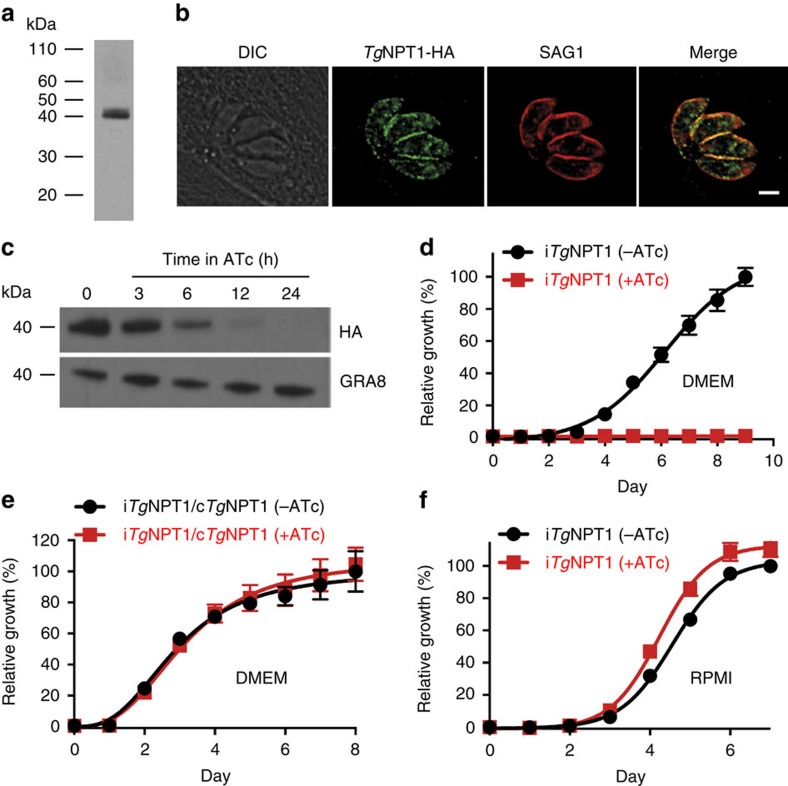
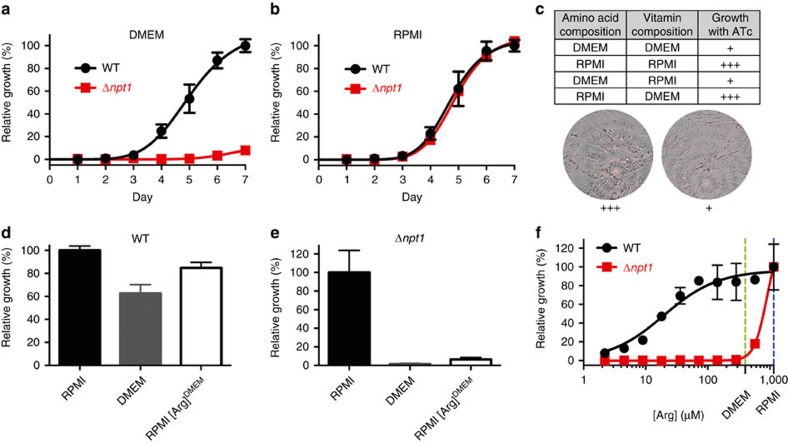
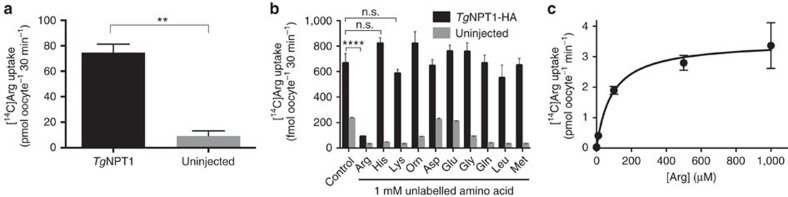
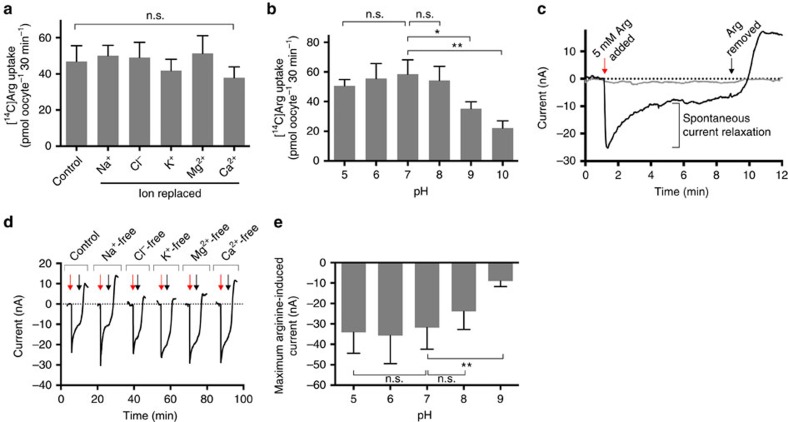
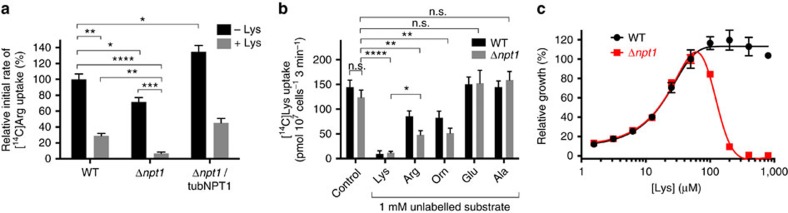
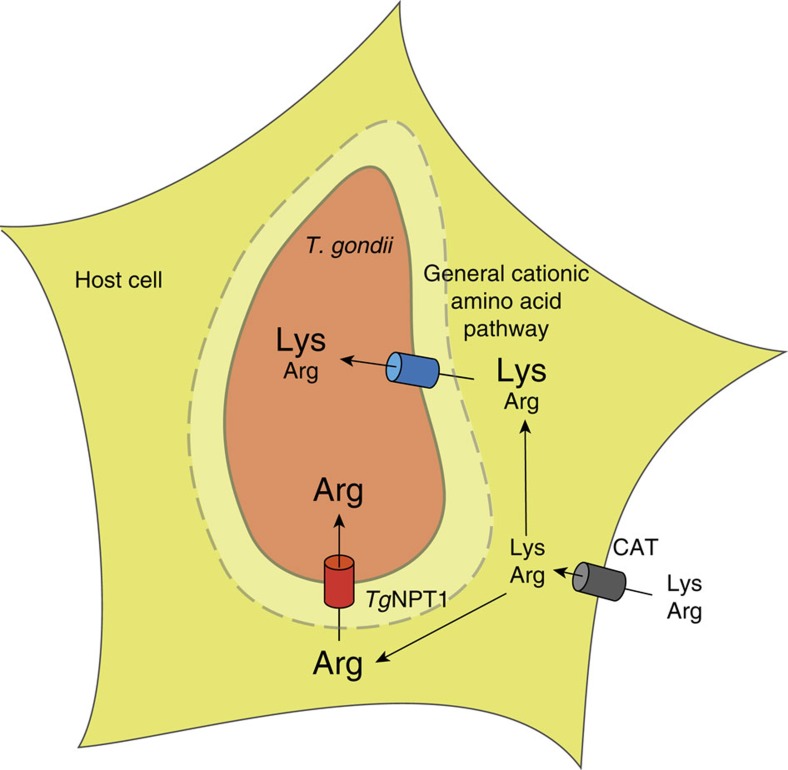
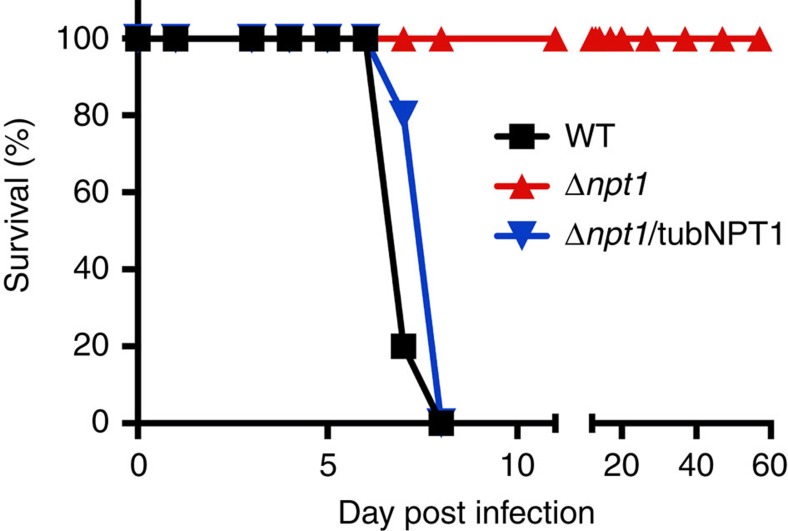
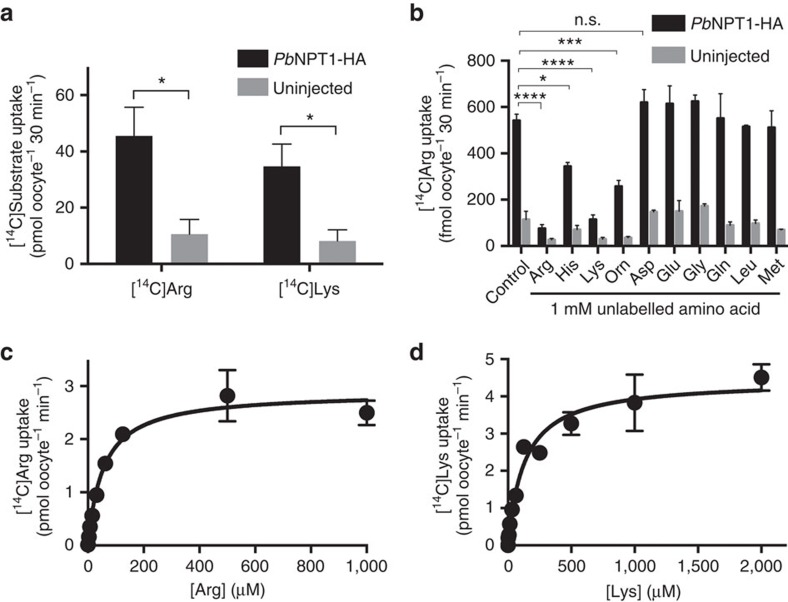
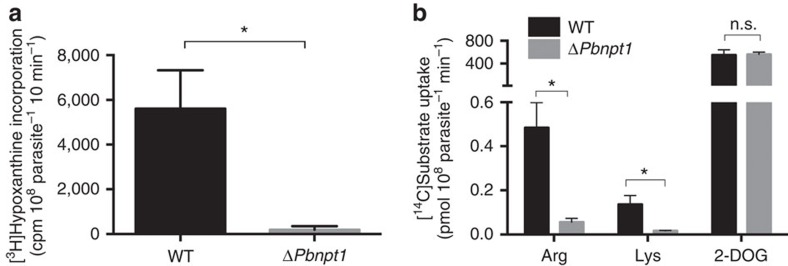
Apicomplexans are obligate intracellular parasites that scavenge essential nutrients from their hosts via transporter proteins on their plasma membrane. The identities of the transporters that mediate amino acid uptake into apicomplexans are unknown. Here we demonstrate that members of an apicomplexan-specific protein family-the Novel Putative Transporters (NPTs)-play key roles in the uptake of cationic amino acids. We show that an NPT from Toxoplasma gondii (TgNPT1) is a selective arginine transporter that is essential for parasite survival and virulence. We also demonstrate that a homologue of TgNPT1 from the malaria parasite Plasmodium berghei (PbNPT1), shown previously to be essential for the sexual gametocyte stage of the parasite, is a cationic amino acid transporter. This reveals a role for cationic amino acid scavenging in gametocyte biology. Our study demonstrates a critical role for amino acid transporters in the survival, virulence and life cycle progression of these parasites.


Conflict of interest statement

The authors declare no competing financial interests.

Figures

Figure 1
Figure 1. TgNPT1 is a plasma membrane protein essential for parasite growth in DMEM but not in RPMI.
(a) Western blot analysis of TgNPT1-HA, probed with anti-HA antibodies. (b) Immunofluorescence assay of TgNPT1-HA (green) reveals partial colocalization with the plasma membrane marker SAG1 (red) (Pearson's Correlation Coefficient mean±SD=0.81±0.04, n=6). The scale bar is 2 μm. (c) Western blot analysis demonstrating iTgNPT1-HA knockdown in the presence of ATc. Parasites were grown for 0, 3, 6, 12 and 24 h in the presence of ATc. GRA8 is a loading control. (df) Fluorescence growth assays for iTgNPT1 parasites (d,f) and iTgNPT1 parasites complemented with constitutively-expressed TgNPT1 (e); iTgNPT1/cTgNPT1), grown in DMEM (d,e) or RPMI (f), in the absence (black) or presence (red) of ATc. Growth is expressed as a percentage of that measured in parasites grown in the absence of ATc on the final day of the experiment. The data shown are averaged from three technical replicates (±s.d.), and are representative of those obtained in three biological replicates.
Figure 2
Figure 2. Growth of parasites lacking TgNPT1 is modulated by arginine.
(a,b) Fluorescence growth assays for WT (black) and Δnpt1 (red) parasites grown in DMEM (a) or RPMI (b). Growth is expressed relative to the maximum growth of WT parasites on the final day of the experiment under each of the conditions tested. The data shown are averaged from three technical replicates (±s.d.) and are representative of those obtained in three biological replicates. (c) Growth of iTgNPT1 parasites in the presence of ATc in medium having the concentrations of amino acids and vitamins present in either RPMI or DMEM. The parasites grew well (+++) in medium containing the concentrations of amino acid present in RPMI, but poorly (+) in medium containing the concentrations of amino acids present in DMEM. (d,e) Growth of WT (d) and Δnpt1 (e) parasites in the following media: RPMI (black), DMEM (grey) or RPMI containing the concentration of arginine present in DMEM (400 μM; RPMI[Arg]DMEM; white). Parasites were cultured until those grown in RPMI reached mid-logarithmic stage. The growth of parasites in each medium is plotted as a percentage of the average growth of parasites in RPMI. The average of three technical replicates±s.d. of a single experiment are shown. (f) Fluorescence growth assay for WT (black) and Δnpt1 (red) parasites grown for 4 days in media containing a range of arginine concentrations. Parasite growth is expressed as a percentage of that measured at the highest arginine concentration (1.15 mM) for each parasite line. The arginine concentrations in DMEM and RPMI are indicated by the vertical green and blue dashed lines, respectively. The data shown are averaged from three technical replicates (±s.d.) and are representative of those obtained in three biological replicates.
Figure 3
Figure 3. TgNPT1 is an arginine transporter.
(a) [14C]Arg uptake into X. laevis oocytes expressing TgNPT1-HA (black), or into uninjected controls (grey). The data are derived from the 30 min time point of Supplementary Fig. 5b. Uptake was measured in the presence of 100 μM unlabelled arginine and 289 nM [14C]Arg. The data are averaged from three independent experiments and are shown±s.e.m. (**P<0.01; Student's t test). (b) [14C]Arg uptake, measured over 30 min, into X. laevis oocytes expressing TgNPT1-HA (black) or into uninjected oocytes (grey), in the absence (control) or presence of a 1 mM concentration of a range of unlabelled amino acids, and 289 nM [14C]Arg. The data are averaged from three experiments, each conducted on oocytes from a different frog, and are shown±s.e.m. (****P<0.0001; n.s.=not significant; ANOVA. Where P is not indicated for comparisons between uptake in the presence and absence of unlabelled amino acids in TgNPT1-HA expressing oocytes, the differences are not significant). (c) Concentration-dependence of TgNPT1-mediated arginine transport in X. laevis oocytes expressing TgNPT1-HA. [14C]Arg uptake was measured over 30 min in the presence of varying concentrations of arginine (0–1 mM). At each of the arginine concentrations tested, uptake measured in uninjected oocytes was subtracted from that in oocytes expressing TgNPT1-HA to yield TgNPT1-mediated transport. The data were averaged from three experiments, each conducted on oocytes from a different frog, and are shown±s.e.m. The Michaelis–Menten equation was fitted to the data by non-linear regression (Km=88±16 μM, mean±s.e.m.; Vmax=3.5±0.1 pmol oocyte−1 min−1, mean±s.e.m.).
Figure 4
Figure 4. Characteristics of arginine transport by TgNPT1.
(a,b) Ion-dependence (a) and pH-dependence (b) of TgNPT1-mediated arginine transport in oocytes expressing TgNPT1-HA. The uptake of 0.4 μCi ml−1 (1.1 μM) [14C]Arg was measured in the presence of 100 μM unlabelled arginine in oocytes, in either complete ND96 uptake buffer (control), media in which Na+, Cl, K+, Mg2+, or Ca2+ ions were replaced (a), or media pH-adjusted to pH 5–10 (b). Uptake measured in uninjected control oocytes was subtracted from that measured in TgNPT1-HA-expressing oocytes to yield the TgNPT1-mediated uptake. All data were averaged from three independent experiments, each conducted on oocytes from a different frog (*P<0.05, **P<0.01; n.s.=not significant; ANOVA). (c) A representative trace for the arginine-induced current in a TgNPT1-HA-expressing oocyte (black) and an uninjected oocyte (grey). The red arrow indicates the point of addition of 5 mM arginine to the ND96 medium and the black arrow indicates the point at which arginine was removed. The spontaneous current relaxation following the addition of 5 mM arginine is indicated. (d) Representative traces of arginine-induced currents in TgNPT1-HA-expressing oocytes, suspended in complete ND96 medium (control) and in media lacking Na+, Cl, K+, Mg2+ or Ca2+ ions. For all current traces, the resting current before arginine addition was set to 0. Red arrows indicate the points of addition of 5 mM arginine to the ND96 medium and black arrows indicate the points at which arginine was removed. The traces are representative of n=8 oocytes under each of the conditions tested. (e) pH dependence of the maximum arginine-induced current in oocytes expressing TgNPT1-HA. Oocytes were equilibrated in media of the relevant pH and the maximum amplitude of the current following the addition of 5 mM arginine was measured. For each pH, the mean arginine-induced current is shown±s.d. (n=8; **P<0.01; n.s.=not significant; ANOVA).
Figure 5
Figure 5. Arginine uptake into T. gondii is mediated by TgNPT1 and by a TgNPT1-independent cationic amino acid uptake pathway.
(a) [14C]Arg uptake in WT, Δnpt1 and Δnpt1/tubNPT1 parasites in the absence (black) and presence (grey) of 80 μM unlabelled lysine, expressed as a percentage of the initial rate of [14C]Arg uptake in WT parasite measured in the absence of lysine. Uptake was measured in parasites suspended in PBS containing 10 mM glucose, 40 μM unlabelled arginine and 0.1 μCi ml−1 (289 nM) [14C]Arg. The initial rates of [14C]Arg uptake were derived from the initial slopes of the time courses shown in Supplementary Fig. 7a. The mean initial rate of [14C]Arg uptake in WT parasite measured in the absence of lysine was 900±61 pmol 107 cells−1 min−1 (mean±s.e.m.; n=3). The data shown represent the mean±s.e.m. from three independent experiments (*P<0.05; **P<0.01; ***P<0.001; ****P<0.0001; Student's t test). (b) [14C]Lys uptake in T. gondii. The uptake of 0.1 μCi ml−1 (307 nM) [14C]Lys (in the presence of 50 μM unlabelled lysine) was measured over 3 min (within the initial linear phase of uptake; Supplementary Fig. 7b) in WT (black) and Δnpt1 (grey) parasites, suspended either in the presence or absence of a 1 mM concentration of the cationic amino acids lysine (Lys), arginine (Arg) or ornithine (Orn), the anionic amino acid glutamate (Glu), or the small neutral amino acid alanine (Ala). The results are averaged from those obtained in three separate experiments±s.e.m. (*P<0.05; **P<0.01; ****P<0.0001; n.s.=not significant; ANOVA). (c) Fluorescence growth assay for WT (black) and Δnpt1 (red) parasites cultured for 4 days in media having a range of lysine concentrations and a constant 400 μM arginine. Growth is expressed as a percentage of that measured at 50 μM lysine for each parasite strain. The data shown are averaged from three technical replicates (shown±s.d.) and are representative of those obtained in three biological replicates.
Figure 6
Figure 6. A model for arginine transport into T. gondii parasites.
Cationic amino acids such as arginine and lysine enter host cells through cationic amino acid transporters (CAT; grey cylinder). Arginine in the host cell cytosol crosses the parasitophorous vacuole membrane (dashed line) through non-selective pores, and is taken up by the parasite through two pathways. TgNPT1 (red cylinder) is a selective arginine transporter, and serves as a major route for arginine uptake in vivo. A general cationic amino acid transport system (blue cylinder) facilitates the TgNPT1-independent uptake of both arginine and lysine.
Figure 7
Figure 7. TgNPT1 is essential for parasite virulence in vivo.
Five Balb/c mice were infected with 106 WT (black), Δnpt1 (red) or Δnpt1/tubNPT1 (blue) parasites and monitored for symptoms of toxoplasmosis. The data for WT and Δnpt1 parasite infections are derived from two independent experiments, whereas data for Δnpt1/tubNPT1 infections are derived from a single experiment.
Figure 8
Figure 8. PbNPT1 is a cationic amino acid transporter.
(a) Uptake of [14C]Arg and [14C]Lys into X. laevis oocytes expressing PbNPT1-HA (black), or into uninjected controls (grey). The data are derived from the 30 min time points of Supplementary Fig. 5e,f. Uptake was measured in the presence of 289 nM [14C]Arg, 100 μM unlabelled arginine and 125 μM unlabelled methionine or 307 nM [14C]Lys, 100 μM unlabelled lysine and 500 μM unlabelled methionine. The data are averaged from three independent experiments and are shown±s.e.m. (*P<0.05; Student's t test). (b) Uptake of [14C]Arg into oocytes expressing PbNPT1-HA (black) or uninjected oocytes (grey), incubated in the presence of 289 nM [14C]Arg and in either the absence (control) or presence of a 1 mM concentration of a range of unlabelled amino acids, and 125 μM unlabelled methionine. The data are averaged from three experiments, each conducted on oocytes from a different frog, and are shown±s.e.m. (*P<0.05; ***P<0.001; ****P<0.0001; n.s.=not significant; ANOVA. Where P is not indicated for comparisons between uptake in the presence and absence of unlabelled amino acids in PbNPT1-HA expressing oocytes, the differences are not significant). (c,d) Concentration-dependence of PbNPT1-mediated arginine and lysine transport in X. laevis oocytes expressing PbNPT1-HA. The uptake of [14C]Arg (c) and [14C]Lys (d) was measured over 30 min, in the presence of 125 μM (c) or 500 μM (d) unlabelled methionine. At each of the concentrations tested, uptake measured in control (uninjected) oocytes was subtracted from that in oocytes expressing PbNPT1 to yield PbNPT1-mediated transport. The data were averaged from three experiments, each conducted on oocytes from a different frog, and are shown±s.e.m. The Michaelis–Menten equation was fitted to the data by non-linear regression. For arginine, Km=41±9 μM, mean±s.e.m.; Vmax=2.6±0.1 pmol oocyte−1 min−1, mean±s.e.m. For lysine, Km=130±26 μM, mean±s.e.m.; Vmax=4.4±0.2 pmol oocyte−1 min−1, mean±s.e.m.
Figure 9
Figure 9. PbNPT1 is essential for microgametogenesis and mediates the uptake of cationic amino acids into P. berghei parasites.
(a) Quantification of microgamete formation in WT and ΔPbnpt1 parasites by measuring [3H]hypoxanthine incorporation following induction of microgametogenesis by temperature shift and the addition of xanthurenic acid. Data were averaged from three biological replicates, and are shown±s.e.m. (*P<0.05; Student's t test). (b) Uptake of [14C]Arg, [14C]Lys and [14C]2-DOG by asexual-stage WT (black) or ΔPbnpt1 (grey) parasites, isolated from their host erythrocytes by saponin permeabilisation of the host erythrocyte and parasitophorous vacuole membranes. The isolated parasites were suspended in PBS containing either 0.1 μCi ml−1 (289 nM) [14C]Arg, 0.1 μCi ml−1 (307 nM) [14C]Lys, or 0.1 μCi ml−1 (1.8 μM) [14C]2-DOG. Incorporation was measured after 4 min, a time point that is approximately within the linear uptake phase of arginine in P. falciparum. Results are expressed as mean±s.e.m., n=3 (*P<0.05; n.s.=not significant; ANOVA).

References

    1. van Dooren G. G. & Striepen B. The algal past and parasite present of the apicoplast. Annu. Rev. Microbiol. 67, 271–289 (2013). - PubMed
    1. Coppens I. Exploitation of auxotrophies and metabolic defects in Toxoplasma as therapeutic approaches. Int. J. Parasitol. 44, 109–120 (2014). - PubMed
    1. Augagneur Y. et al.. Identification and functional analysis of the primary pantothenate transporter, PfPAT, of the human malaria parasite Plasmodium falciparum. J. Biol. Chem. 288, 20558–20567 (2013). - PMC - PubMed
    1. Blume M. et al.. Host-derived glucose and its transporter in the obligate intracellular pathogen Toxoplasma gondii are dispensable by glutaminolysis. Proc. Natl Acad. Sci. USA 106, 12998–13003 (2009). - PMC - PubMed
    1. Carter N. S. et al.. Isolation and functional characterization of the PfNT1 nucleoside transporter gene from Plasmodium falciparum. J. Biol. Chem. 275, 10683–10691 (2000). - PubMed

Publication types

MeSH terms

Substances