. 2017 Feb 16:8:14395.
doi: 10.1038/ncomms14395.

microRNA-17 family promotes polycystic kidney disease progression through modulation of mitochondrial metabolism

Affiliations

microRNA-17 family promotes polycystic kidney disease progression through modulation of mitochondrial metabolism

Sachin Hajarnis et al. Nat Commun. .

Abstract

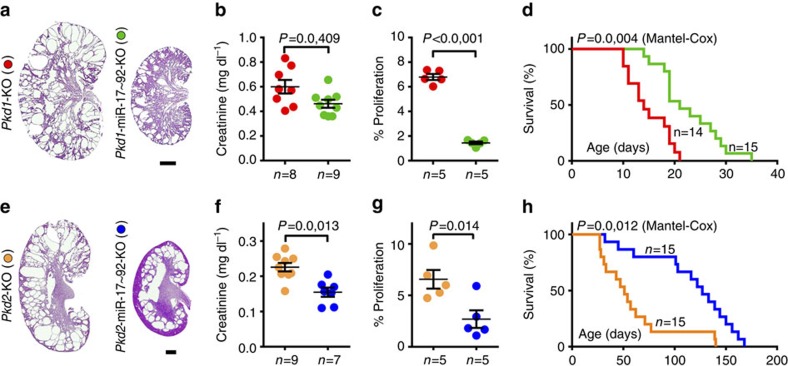
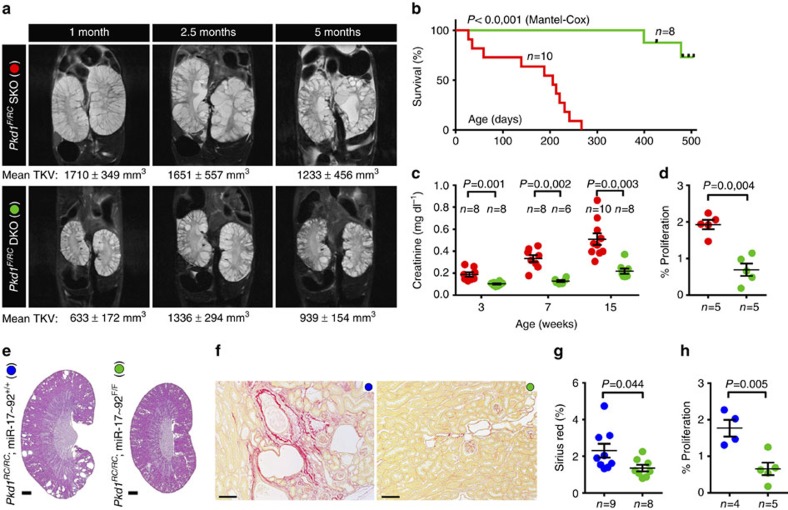
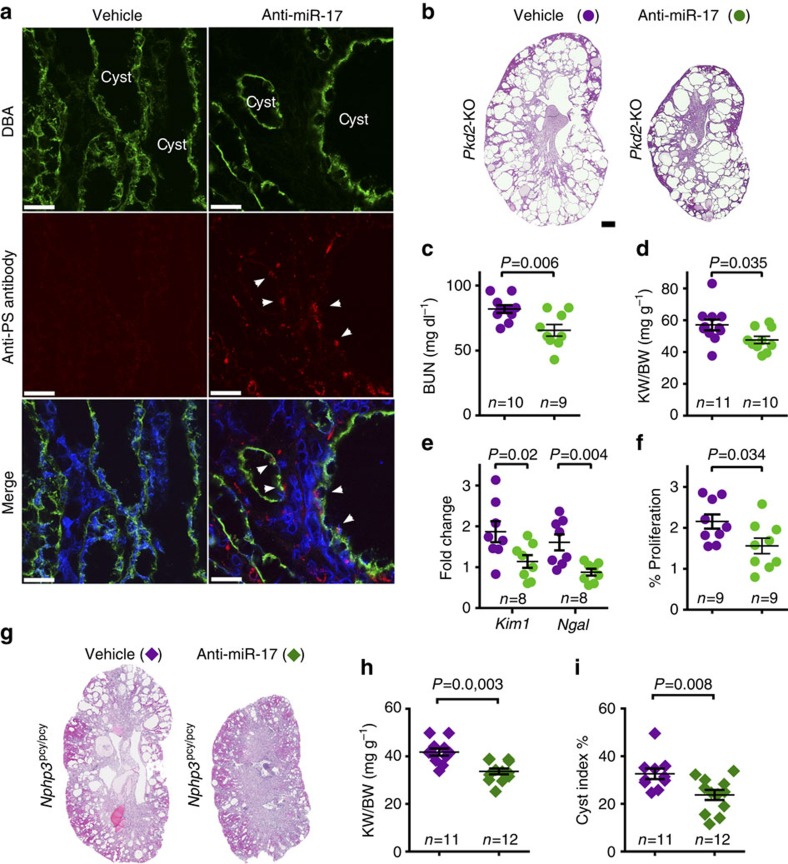
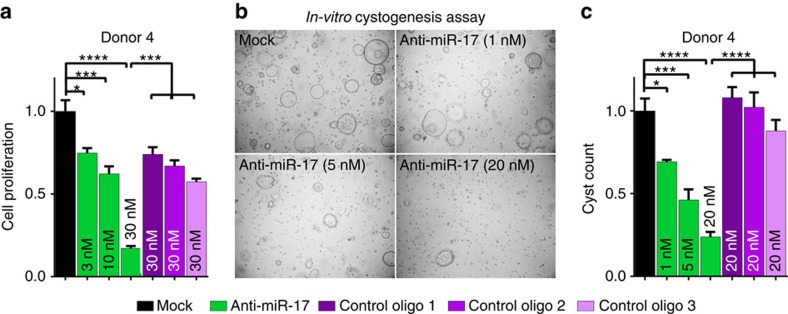
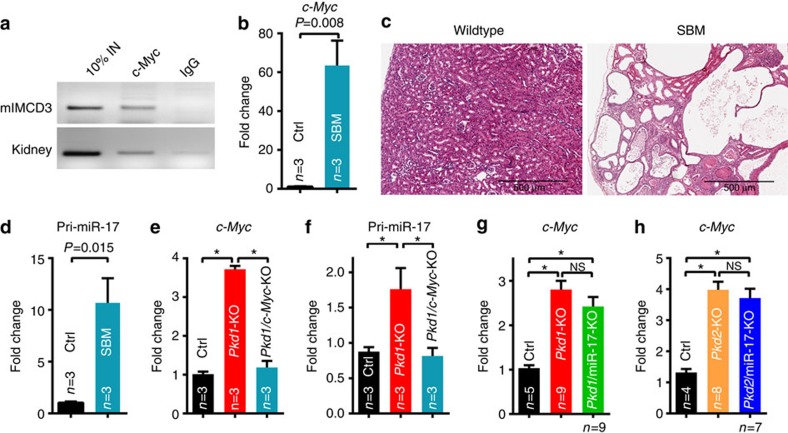
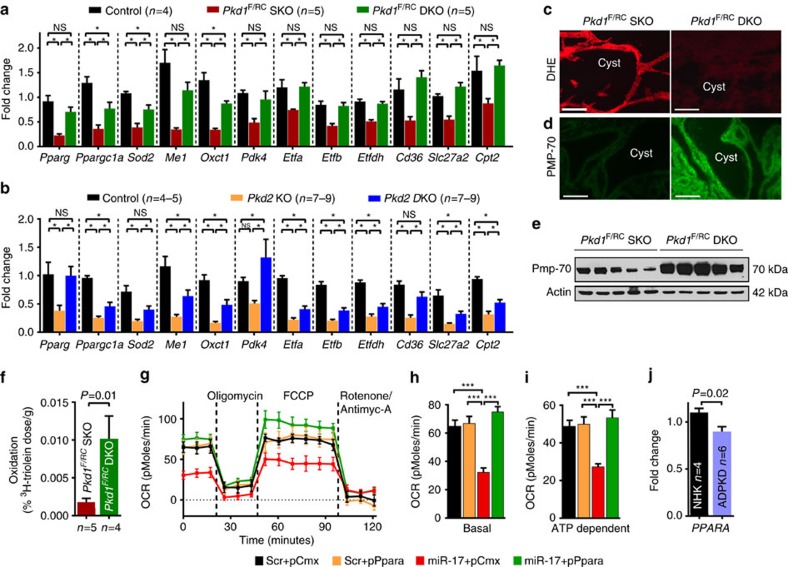
Autosomal dominant polycystic kidney disease (ADPKD) is the most frequent genetic cause of renal failure. Here we identify miR-17 as a target for the treatment of ADPKD. We report that miR-17 is induced in kidney cysts of mouse and human ADPKD. Genetic deletion of the miR-17∼92 cluster inhibits cyst proliferation and PKD progression in four orthologous, including two long-lived, mouse models of ADPKD. Anti-miR-17 treatment attenuates cyst growth in short-term and long-term PKD mouse models. miR-17 inhibition also suppresses proliferation and cyst growth of primary ADPKD cysts cultures derived from multiple human donors. Mechanistically, c-Myc upregulates miR-17∼92 in cystic kidneys, which in turn aggravates cyst growth by inhibiting oxidative phosphorylation and stimulating proliferation through direct repression of Pparα. Thus, miR-17 family is a promising drug target for ADPKD, and miR-17-mediated inhibition of mitochondrial metabolism represents a potential new mechanism for ADPKD progression.


Conflict of interest statement

Vishal Patel and John Androsavich have applied for a patent related to the treatment of polycystic kidney disease using miR-17 inhibitors. The Patel lab has a sponsored research agreement with Regulus Therapeutics. The remaining authors declare no conflict of interests.

Figures

Figure 1
Figure 1. miR-17 is upregulated in kidney cysts of mouse and human ADPKD.
Nanostring nCounter microarray analysis was performed to compare miRNA expression patterns between 10-day-old wild type (n=3) and Pkd1-KO kidneys (n=3), and 21-day-old wild type (n=3) and Pkd2-KO kidneys (n=3). (a,b) The differentially expressed miRNA families in Pkd1-KO and Pkd2-KO are shown. The red circles mark Log2 fold change when only differentially expressed family members are included. The stacked bars mark Log2 fold change when all expressed family members irrespective of statistical significance are included. The values in parenthesis indicate the percentage contribution of each miRNA family to the total miRNA pool in cystic kidneys. The miR-17 family is highlighted in red. (c) Dysregulated miRNAs exhibited correlated expression pattern (R2=0.87) between Pkd1-KO and Pkd2-KO kidneys suggesting that a common set of aberrantly expressed miRNAs may underlie ADPKD pathogenesis. (d,e) Q-PCR analysis demonstrated that miR-17 is upregulated at cystic stages (P7 & P10 for Pkd1-KO and P21 & P28 for Pkd2-KO) but not at pre-cystic stages (P1 for Pkd1-KO and P14 for Pkd2-KO). In situ hybridization (ISH) was performed using an LNA-modified anti-miR-17 probe. The kidney sections were counterstained with nuclear fast red to mark nuclei. (f) Representative ISH images of kidney sections from wild type, Pkd1F/RCSKO, Pkd2-KO, Pkd2-miR-17∼92KO mice (negative control) and miR-17∼92Tg (positive control) are shown. Expression of miR-17 (blue) was increased in cysts (cy) of Pkd1F/RCSKO and Pkd2-KO compared with renal tubules of wild-type mice. miR-17 expression was abolished in cysts of Pkd2-miR-17∼92KO mice, whereas its expression was induced in renal tubules of miR-17∼92Tg mice, indicating that the in situ probe specifically detects miR-17. (g) ISH was performed on kidney sections from four NHK and ADPKD samples. Representative ISH images from one NHK and ADPKD sample are shown. miR-17 expression was not detected by ISH in NHK kidney sections. The percentage of miR-17-positive cysts per kidney section from four human ADPKD patients (#6–9) is shown in the graph. The total number of cysts per section is shown above each bar. P indicates postnatal day. Error bars indicate s.e.m. * indicates P<0.05, ns indicates P>0.05. Student's unpaired t-test (d,e). Scale bars, 50 μm (f) and 20 μm (g).
Figure 2
Figure 2. miR-17∼92 deletion attenuates cyst growth in early-onset ADPKD models.
To understand the biological relevance of miR-17 upregulation, the miR-17∼92 cluster was deleted in orthologous ADPKD models. (a) H&E staining, (b) serum creatinine levels and (c) quantification of proliferating cyst epithelial cells in kidneys of 10-day-old Pkd1-KO and Pkd1-miR-17∼92KO mice is shown. (d) Kaplan-Meier survival curves of Pkd1-KO (red line) and Pkd1-miR-17∼92KO (green line) mice. The median survival of Pkd1-miR-17∼92KO (21-days) was improved by 50% compared with Pkd1-KO mice (14 days). (e) H&E staining, (f) serum creatinine levels and (g) quantification of proliferating cyst epithelial cells in kidneys of 21-day-old Pkd2-KO and Pkd2-miR-17∼92KO mice is shown. (h) Kaplan-Meier survival curves of Pkd2-KO (orange line) and Pkd2-miR-17∼92KO (blue line) mice. The median survival of Pkd2-miR-17∼92KO (127 days) was doubled compared with Pkd2-KO mice (51 days). Error bars represent s.e.m. Student's unpaired t-test (b,c,f,g) and Log rank (Mantel-Cox) test (d,h). Scale bars, 1 mm.
Figure 3
Figure 3. miR-17∼92 deletion attenuates disease progression in long-lived and slow cyst growth models of ADPKD.
(ad) The role of miR-17∼92 was studied in Pkd1F/RCSKO mice, a long-lived model of ADPKD. (a) Representative MRI images and mean MRI-estimated TKV of 1-,2.5-, and 5-month-old Pkd1F/RCSKO and Pkd1F/RCDKO mice are shown. TKV normalized to body weight was reduced in Pkd1F/RCDKO compared with Pkd1F/RCSKO mice at all time points (n=8–10 each group, P<0.01). (b) Kaplan-Meier survival curves of Pkd1F/RCSKO (red line) and Pkd1F/RCDKO mice (green line) are shown. The median survival (>14 months) of Pkd1F/RCDKO mice was more than doubled compared with Pkd1F/RCSKO mice (206 days). (c) Serum creatinine level was reduced in 3-,7-, and 15-week-old Pkd1F/RCDKO mice (green circles) compared with Pkd1F/RCSKO (red circles) mice. (d) Quantification revealed that cyst epithelial cell proliferation was reduced in 21-day-old Pkd1F/RCDKO mice compared with Pkd1F/RCSKO mice. (eh) The role of miR-17∼92 was studied in Pkd1RC/RC mice, a slow cyst growth model of ADPKD. (e) H&E and (f) Sirius red staining of kidney sections from 6-month-old Pkd1RC/RC (blue circles) and Pkd1RC/RC;Ksp/cre; miR-17∼92F/F (green circles) mice. Quantification of the Sirius red staining (g) and the number of proliferating cells (h) revealed that both interstitial fibrosis and tubular proliferation were reduced after miR-17∼92 deletion in Pkd1RC/RC mice. Error bars represent s.e.m. Log rank (Mantel-Cox) test (b) Student's unpaired t-test (a,c,d,g,h). Scale bars, 1 mm (e) and 100 μm (f).
Figure 4
Figure 4. Anti-miR-17 demonstrates therapeutic efficacy in short-term and long-term PKD mouse models.
(a) Pkd2-KO mice were injected with 20 mg kg−1 of anti-miR-17 compound or PBS on postnatal day (P) 21, 22 and 23, and kidneys were harvested on P26. Kidney sections were co-stained with DBA (green, a marker of collecting ducts) and anti-PS antibody (red, antibody labels anti-miR-17 compound). Anti-PS staining was observed in collecting duct-derived cysts (arrowheads) of Pkd2-KO mice injected with anti-miR-17 indicating that the compound was delivered to collecting duct cysts. No anti-PS antibody staining was noted in Pkd2-KO mice injected with PBS. To assess the therapeutic efficacy of this compound, Pkd2-KO mice were injected with anti-miR-17 or PBS at P10, 11, 12 and 19, and kidneys were harvested on P28. (b) H&E staining of kidney sections from 28-day-old Pkd2-KO mice injected with anti-miR-17 or PBS. (c) Serum BUN levels, (d) kidney-weight-to-body-weight ratio, (e) expression of Kim1 and Ngal and (f) the number of proliferating cyst epithelial cells were reduced in Pkd2-KO mice that were injected with anti-miR-17 compared with PBS. (gi) To assess the therapeutic efficacy of anti-miR-17 in a long-term PKD model, 1-month-old Nphp3pcy/pcy mice were injected with 50 mg kg−1 of anti-miR-17 or PBS once a week for 26 weeks. These mice were euthanized at 30 weeks of age. (g) Representative images of H&E-stained kidney sections from 30-week-old Nphp3pcy/pcy mice injected with PBS or anti-miR-17 are shown. (h) kidney-weight-to-body-weight ratios and (i) cyst index were reduced in Nphp3pcy/pcy mice that were injected with anti-miR-17 compared with PBS. Error bars represent s.e.m. Student's unpaired t-test (cf,h,i). Scale bars, 25 μm (a) and 1 mm (b).
Figure 5
Figure 5. Anti-miR-17 treatment reduces proliferation and cyst growth in in vitro models of human ADPKD.
Primary cyst epithelial cultures derived from kidneys of ADPKD patients were transfected with anti-miR-17 (dose: 3 nM, 10 nM or 30 nM) or three different control oligonucleotides (dose: 30 nM, control oligo1, 2 and 3). These cells were then cultured to measure proliferation or in vitro cyst formation (3-Dimension Matrigel). (a) Data for proliferation (n=5 for each treatment and dose) and (b) representative images and (c) quantification of cyst formation (n=3 for each treatment and dose) using primary cultures derived from ADPKD Donor 4 are shown. Anti-miR-17 reduced proliferation and cyst count in a dose-dependent manner. Data from the other ADPKD Donors can be found in the Supplementary Fig. 6. Error bars represent s.e.m. *indicates P<0.05, **indicates P<0.01, ***indicates P<0.005 and ****indicates P<0.001. One-way ANOVA, Tukey's multiple comparisons test.
Figure 6
Figure 6. c-Myc promotes miR-17∼92 expression in cystic kidneys.
(a) Chromatin immunoprecipitation was performed using an antibody against c-Myc and control IgG. Semi-qPCR analysis of the immunoprecipitated DNA revealed that c-Myc specifically binds to the miR-17∼92 promoter in mIMCD3 cells and mouse kidney tissue. No PCR product was observed in IgG control. To assess in vivo functional interaction, c-Myc transgenic (SBM) mice were analysed. (b) Q-PCR analysis showed c-Myc was upregulated and (c) H&E staining showed numerous kidney cysts in 6-month-old SBM compared with control mice. (d) Q-PCR analysis revealed that pri-miR-17 was increased by 12-fold in SBM compared with control kidneys (n=3), suggesting that c-Myc promotes miR-17 transcription in the context of PKD. To study whether c-Myc regulates miR-17∼92 expression in ADPKD models, Ksp/Cre; Pkd1F/F; c-MycF/F (Pkd1/c-Myc-KO) mice were generated. (e,f) Q-PCR analysis showing c-Myc and pri-miR-17 expression in 10-day-old control (Ctrl), Pkd1-KO and Pkd1/c-Myc-KO kidneys (n=3, each genotype). c-Myc deletion reduced pri-miR-17 expression in Pkd1-KO kidneys. (g,h) In contrast, Q-PCR analysis revealed that c-Myc expression was not affected by deletion of miR-17∼92 in Pkd1 or Pkd2-KO mice. Thus, c-Myc functions upstream of miR-17∼92 in ADPKD models. Error bars represent s.e.m. *Indicates P<0.05. Student's unpaired t-test (b,d) One-way ANOVA, Tukey's multiple comparisons test (eh). Scale bar 500 μm (c).
Figure 7
Figure 7. miR-17∼92 deletion results in improved expression of mitochondrial and metabolism-related gene networks.
RNA-Seq analysis was performed to compare mRNA expression profiles. (a) Top differentially regulated pathways in 21-day-old Pkd1F/RCDKO compared with Pkd1F/RCSKO kidneys, and 21-day-old Pkd2-miR-17∼92KO compared with Pkd2-KO kidneys are shown. (b) Ingenuity pathway analysis software was used to identify the upstream regulators (URs) that may be responsible for the gene expression changes observed after miR-17∼92 deletion in ADPKD models. Top 10 (based on z scores) differentially expressed gene networks and their associated URs in Pkd1F/RCDKO compared with Pkd1F/RCSKO kidneys are shown. These networks were also differentially regulated in Pkd2-miR-17∼92KO compared with Pkd2-KO kidneys. Positive z scores (shades of orange) indicate activation whereas negative z scores (shades of blue) indicate inhibition of the gene networks. The P values (shades of purple) represent the level of statistical confidence for the prediction that the differentially expressed gene network is indeed regulated by the indicated UR. Large interconnected gene networks controlled by URs PPARα, PPARg and PPARGC1a were predicted to be activated after miR-17∼92 deletion in both ADPKD models. (c) RNA-Seq data were intersected with high-probability miR-17∼92 targets predicted by TargetScan. This analysis identified Pparα and 24 other common putative miR-17∼92 targets in the context of ADPKD. Expression of these genes was decreased (shades of green) in single knockout (SKO) compared with their respective control (Ctl) kidneys. In contrast, the expression of these genes was increased (shades of red) in double knockout (DKO) compared with their respective SKO kidneys. SKO indicates either Pkd1F/RCSKO or Pkd2-KO, whereas DKO indicates either Pkd1F/RCDKO or Pkd2-miR-17∼92KO kidneys. The circles indicate predicted binding sites for the various miRNA families derived from the miR-17∼92 cluster. (d) Q-PCR analysis showing Pparα expression in the indicated mouse models or cell lines. (e) Western blot showing increased PPARα expression in Pkd1F/RCDKO compared with Pkd1F/RCSKO kidneys. (f) PPARα antibody staining revealed that PPARα expression was increased in cyst epithelia of Pkd1F/RCDKO mice compared with Pkd1F/RCSKO mice. PPARα expression was decreased in mIMCD3 cells treated with miR-17 mimic compared with scramble mimic. Error bars indicate s.e.m. *indicates P<0.05, ns indicates P>0.05. One-way ANOVA, Tukey's multiple comparisons test, Student's unpaired t-test. Scale bars, 50 μm (f, top panel) and 20 μm (f, bottom panel).
Figure 8
Figure 8. miR-17 aggravates cyst growth through direct repression of Pparα.
(a) Human PPARA 3'-UTR PPARΑ 3′-UTR harbours evolutionarily conserved miR-17 (red box) and miR-19 (blue box) binding sites. Watson-Crick base-pairing between miR-17/PPARΑ 3′-UTR and miR-19/PPARΑ 3′-UTR is shown. (b) To test whether these binding sites are functional, mouse Pparα 3′-UTR was cloned into a luciferase reporter plasmid. mIMCD3 cells were co-transfected with this plasmid and scramble (scr, black), miR-17 mimic (red) or miR-19 mimic (blue) (n=3). Luciferase reporter assays revealed that compared with scramble, both miR-17 and miR-19 mimics suppressed wild-type Pparα 3′-UTR. Deleting the miR-17 binding site prevented miR-17-mediated, but not miR-19-mediated, repression. Similarly, deleting the miR-19 binding site abolished miR-19-mediated, but not miR-17-mediated, repression. Combined deletion of both binding sites abrogated repression by both miRNAs. (cf) To test whether reduced Pparα gene dosage is sufficient to enhance proliferation and promote cyst formation, 6-week-old Pparα−/− (n=5), Pkd1RC/RC (n=9) and Pkd1RC/RC; Pparα-KO (n=9) mice were generated and characterized. (c) Q-PCR analysis showing Pparα expression in the indicated mouse models. (d) H&E staining, (e) kidney-weight-to-body-weight ratios and (f) quantification of proliferating epithelial cells in kidneys of Pparα−/−, Pkd1RC/RC and Pkd1RC/RC; Pparα-KO mice is shown. (gk) Conversely, to test whether increasing PPARα activity attenuates proliferation and cyst growth, 18-day-old Pkd2-KO littermates were fed a standard moist chow (Ctl) or a standard moist chow containing fenofibrate (Feno), a Pparα agonist, for 10 days. (g) Q-PCR analysis showed that Pparα expression was increased in Pkd2-KO mice fed Feno compared with Ctl. (h) H&E staining, (i) kidney-weight-to-body-weight ratios, (j) cyst index, and (k) quantification of proliferating cyst epithelial cells in Pkd2-KO mice fed Feno or Ctl is shown. Error bars indicate s.e.m. *indicates P<0.05, **indicates P<0.01, ***indicates P<0.001, and ns indicates P>0.05. One-way ANOVA, Tukey's multiple comparisons test (bg), Student's unpaired t-test (ik). Scale bars, 1 mm.
Figure 9
Figure 9. miR-17 modulates metabolic functions of PPARα.
PPARα regulates a large gene network that modulates several aspects of metabolism including OXPHOS, FAO, and peroxisome function. We tested whether miR-17 affected these functions of PPARα. (a,b) Q-PCR analysis of metabolism-related PPARα target genes in the indicated mouse models. Expression of PPARα targets was reduced in ADPKD models, whereas their expression was increased after miR-17∼92 deletion. (c) To assess mitochondrial function in vivo, kidney sections were stained with dihydroethidium (DHE) to assess reactive oxygen species production. Reactive oxygen species level was markedly decreased in kidneys of 21-day-old Pkd1F/RCDKO mice compared with Pkd1F/RCSKO mice. (d) Kidney sections were stained using an antibody against PMP-70, an abundant and integral membrane protein of peroxisomes. PMP-70 expression was increased in kidney cysts of 21-day-old Pkd1F/RCDKO mice compared with Pkd1F/RCSKO mice. (e) Western blot analysis showing increased PMP-70 expression in kidneys of 21-day-old Pkd1F/RCDKO mice compared with Pkd1F/RCSKO mice. (f) To test whether miR-17∼92 deletion affected FAO, 21-day-old Pkd1F/RCSKO and Pkd1F/RCDKO mice were injected with a 3H-triolein tracer and kidney FAO was measured. Mirroring PPARα expression, FAO was increased in Pkd1F/RCDKO kidneys compared with Pkd1F/RCSKO kidneys. (gi) To determine whether miR-17 affects OXPHOS, Seahorse XF 24 Analyzer was used to measure real-time mitochondrial OCR. (g) Real-time OCR tracings, (h,i) Basal and ATP-dependent OCR of Pkd2−/− cells is shown (n=4). (j) PPARα expression was analysed in NHKs and human ADPKD cells. Q-PCR analysis showed that the expression of PPARα was decreased in cells derived from human ADPKD cysts compared with NHK. Error bars indicate s.e.m. *indicates P<0.05, ***indicates P<0.001, and ns indicates P>0.05. One-way ANOVA, Tukey's multiple comparison test (a,b,h,i), Student's unpaired t-test (f,j).
Figure 10
Figure 10. The proposed mechanism by which miR-17∼92 promotes ADPKD progression.
Mutations of Pkd1 or Pkd2 is associated with increased expression of c-Myc. c-Myc binds to miR-17∼92 promoter and enhances its transcription in cystic kidneys. The miR-17∼92 primary transcript is processed to yield the individual mature miRNAs. In the cytoplasm, the mature miRNAs (miR-17 and miR-19) bind to Pparα 3′-UTR. PPARα is known to regulate the expression of key metabolic genes involved in mitochondrial OXPHOS pathway. miR-17 and miR-19 binding to Pparα 3′-UTR lead to reduced Pparα expression, which in turn affects mitochondrial metabolism in kidney epithelial cells.

Comment in

References

    1. Patel V., Chowdhury R. & Igarashi P. Advances in the pathogenesis and treatment of polycystic kidney disease. Curr. Opin. Nephrol. Hypertens. 18, 99–106 (2009). - PMC - PubMed
    1. Igarashi P. & Somlo S. Polycystic kidney disease. J. Am. Soc. Nephrol. 18, 1371–1373 (2007). - PubMed
    1. Gabow P. A. & Grantham J. J. in Diseases of the Kidney eds Schrier R. W., Gottschalk C. W. Little, Brown (1997).
    1. Bartel D. P. MicroRNAs: genomics, biogenesis, mechanism, and function. Cell 116, 281–297 (2004). - PubMed
    1. van Rooij E. & Olson E. N. MicroRNAs: powerful new regulators of heart disease and provocative therapeutic targets. J. Clin. Invest. 117, 2369–2376 (2007). - PMC - PubMed

Publication types