. 2017 Feb 13:7:42300.
doi: 10.1038/srep42300.

Proteins analysed as virtual knots

Affiliations

Proteins analysed as virtual knots

Keith Alexander et al. Sci Rep. .

Abstract

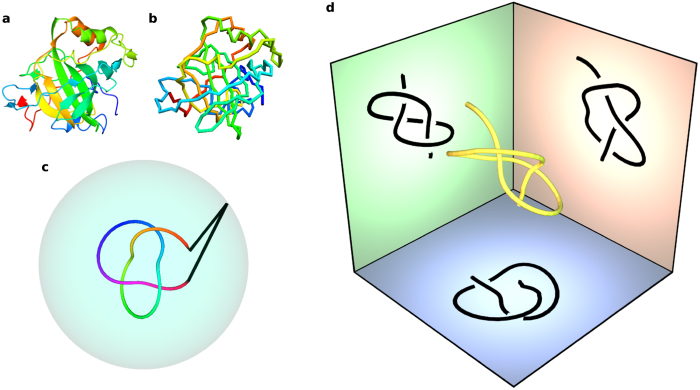
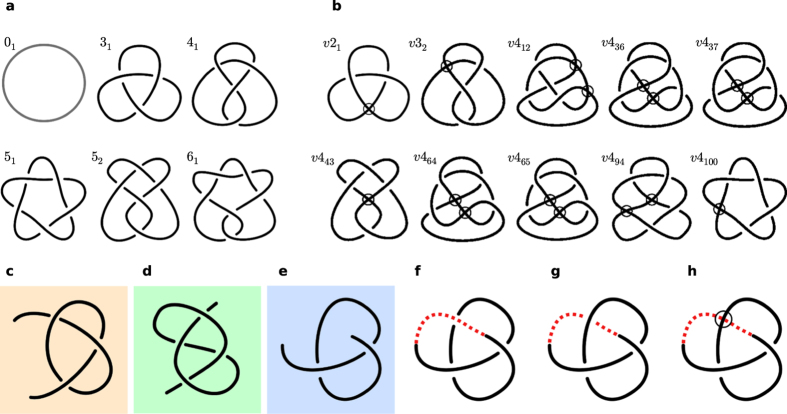
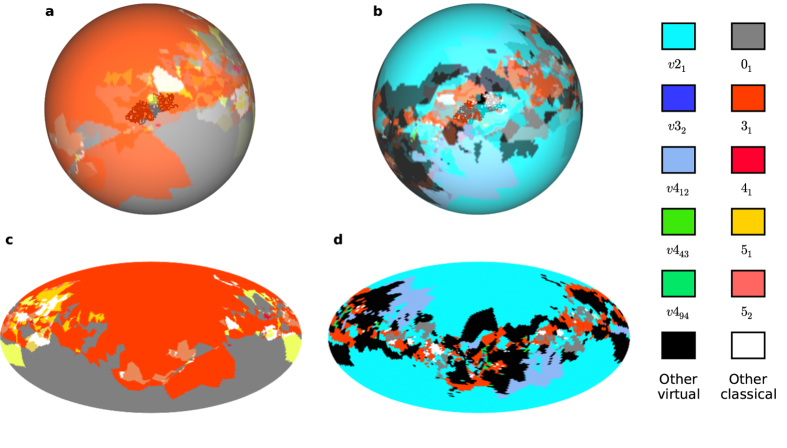
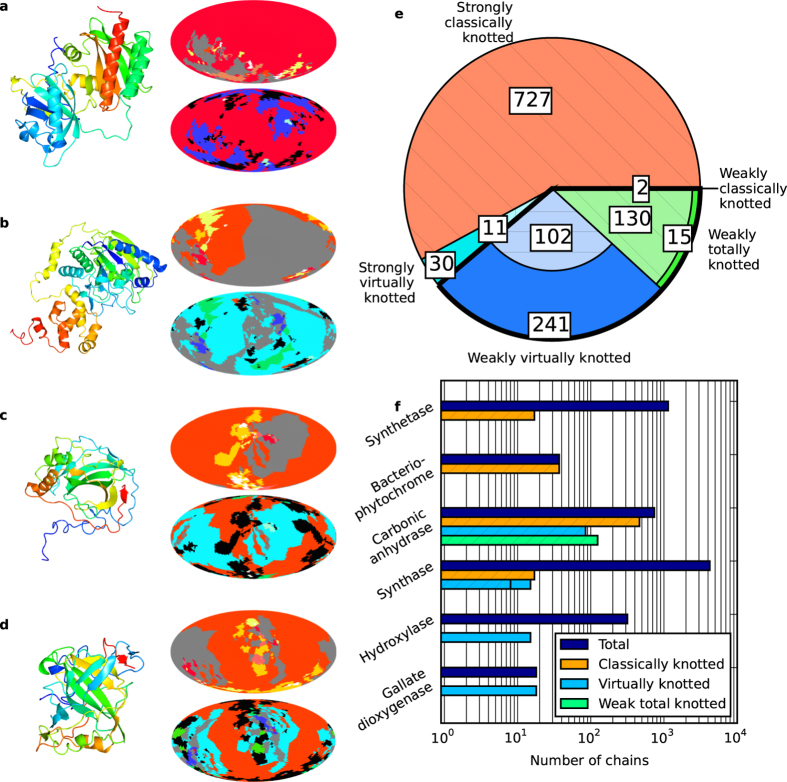
Long, flexible physical filaments are naturally tangled and knotted, from macroscopic string down to long-chain molecules. The existence of knotting in a filament naturally affects its configuration and properties, and may be very stable or disappear rapidly under manipulation and interaction. Knotting has been previously identified in protein backbone chains, for which these mechanical constraints are of fundamental importance to their molecular functionality, despite their being open curves in which the knots are not mathematically well defined; knotting can only be identified by closing the termini of the chain somehow. We introduce a new method for resolving knotting in open curves using virtual knots, which are a wider class of topological objects that do not require a classical closure and so naturally capture the topological ambiguity inherent in open curves. We describe the results of analysing proteins in the Protein Data Bank by this new scheme, recovering and extending previous knotting results, and identifying topological interest in some new cases. The statistics of virtual knots in protein chains are compared with those of open random walks and Hamiltonian subchains on cubic lattices, identifying a regime of open curves in which the virtual knotting description is likely to be important.


Conflict of interest statement

The authors declare no competing financial interests.

Figures

Figure 1
Figure 1. Protein backbone structures as open knotted space curves.
(a) Backbone and some secondary structure of the protein with PDB ID 4COQ, chain A (Thermovibrio ammonificans alpha-carbonic anhydrase). (b) The backbone chain of carbon alpha atoms of the same protein as a piecewise-linear space curve. The colouring along the chain distinguishes different regions and does not have physical meaning. (c) The closure of an open curve from its termini to a point on a surrounding sphere by straight lines. (d) A 3-dimensional open curve and its planar projections in three perpendicular directions; each projection here gives an open knot diagram, where each crossing in the projection indicates which strand passes over or under the other. In this example, each projected knot diagram represents one of two different knot types, as explained in the text. Our analysis of open curves uses many such projections in different directions.
Figure 2
Figure 2. Classical and virtual knot diagrams.
(a) The first six classical knots in the standard tabulation (including the unknot 01); all but 51 have been identified as dominant knot types in at least one protein under sphere closure. (b) The virtual knots with n = 2,3,4 as tabulated in ref. , all of which can arise as virtual closures of open knot diagrams (i.e. the minimally genus one virtual knots, described in Supplementary Note 1). Virtual crossings are shown as circles. (ch) show examples of open diagrams, which may be identified under virtual closure as classical or virtual knots. (ce) are equivalent to the projections from Fig. 1(d). (f) and (g) show (e) closed with a classical arc passing above or below the intervening strands, forming an unknot 01 and trefoil knot 31 respectively, while (h) shows (e) closed instead with a virtual crossing to produce the knot v21.
Figure 3
Figure 3. Classical and virtual knot types found amongst different projection/closure directions for a protein backbone chain.
The protein backbone shown has PDB ID: 4K0B, chain A (Sulfolobus solfataricus S-adenosylmethionine synthetase). Each point is coloured according to the knot type (classical or virtual) found by closure/projection in that direction. Classical and virtual knot types are coloured according to the legend. (a) Classical knots resulting from 3-dimensional sphere closure in each direction. (b) Virtual knot types resulting from virtual closure of the diagram obtained from projection in each direction. (c) and (d) are Mollweide projections of (a) and (b). These images are constructed from sampling 10,000 directions in each case. Antipodal points on the sphere are always associated with the same knot type under virtual closure (up to possibly distinct mirrors for certain virtual knot types), but may produce different classical knots on sphere closure. This protein is considered strongly trefoil (31) knotted under sphere closure, and strongly v21 virtually knotted under virtual closure; it is an unusually strong exemplar of this behaviour, described in the following Section.
Figure 4
Figure 4. Results of virtual closure analysis for knotting in the Protein Data Bank.
Knotting classifications follow the main text; strong classical (virtual) knotting where more than 50% of projections form the same classical (virtual) knot type; weak classical (virtual) knotting when over 50% of projections form classical (virtual) knots but no single knot type dominates, and weak total knotting where the unknotting fraction does not exceed 50% but no other specific class dominates. (ad) Examples of knot type maps (see Fig. 2) for protein chains in these different classes, coloured according to the legend of Fig. 3. The upper (lower) map in each case shows the results of sphere closure (virtual closure): in (a) PDB ID: 4E04, chain A (Rhodopseudomonas palustris RpBphP2 chromophore-binding domain), which is classically knotted in both cases; in (b) PDB ID: 3WKU, chain B (sphinogobium sp. SYK-6 extradiol dioxygenase), which is not knotted under sphere closure but is strongly virtually knotted under virtual closure; in (c) PDB ID: 4XIX, chain A (Chlamydomonas reinhardtii carbonic anhydrase), which is knotted under both sphere and virtual closure, weakly virtually knotted in the latter; and in (d) PDB ID: 3KIG, chain A (Homo sapiens carbonic anhydrase II mutant), which is knotted under sphere closure and exhibits weak total knotting on virtual closure. (e) Numbers of protein chains in each knotting class under virtual closure. (f) Knot types found amongst selected categories of protein chain names, and their distribution amongst knotting classes. In (e) and (f), hatched areas represent chains which were also identified as knotted under sphere closure.
Figure 5
Figure 5. Knotting and virtual knotting probabilities in different open curve ensembles.
The closing distance fraction (CDF) is the ratio of the distance between the open curve’s endpoints with respect to the total curve length. The lines compare the primary properties of closure and virtual knotting: the dark blue line shows knotting probability under sphere closure (considering an open curve as ‘knotted’ if over 50% of directional closures yield a knot); while the light blue line shows virtual knotting probability (considering an open curve as ‘virtually knotted’ if over 50% of directional closures yield a virtual knot, counting both strong and weak virtual knotting). Knotting probabilities are plotted for (a) 6 × 106 open random walks of length 100; (b) all 159,518 proteins analysed in the previous Section, with various lengths and binned according to CDF; (c) 5.5 × 106 length-75 subchains of Hamiltonian walks on cubic lattices of side length 6, binned by CDF. In (b), the sharp peak at a CDF of 0.047 reaches a height of ~0.033, but contains no subtler structure and so the plot is not scaled to show its shape, discussed in the main text. In (c), the fluctuations reflect correlations implicit in the lattice. In each figure, the inset shows a typical example of the curve ensemble, coloured red to blue by hue along its length to distinguish different regions of the curve. Error bars represent the standard error on the mean probability of the knot statistic.

Similar articles

Cited by

References

    1. Branden C. I. & Tooze J. Introduction to Protein Structure. chap. 1 (Garland Science, 1998).
    1. Taylor W. R. A deeply knotted protein structure and how it might fold. Nature 406, 916–9 (2000). - PubMed
    1. Virnau P., Mirny L. A. & Kardar M. Intricate knots in proteins: function and evolution. PLoS Comp Biol 2, e122 (2006). - PMC - PubMed
    1. Millett K. C., Rawdon E. J., Stasiak A. & Sulkowska J. L. Identifying knots in proteins. Biochemical Society Transactions 41, 533–7 (2013). - PubMed
    1. Jamroz M. et al.. Knotprot: a database of proteins with knots and slipknots. Nucleic Acids Research 43, D306–14 (2014). - PMC - PubMed

Publication types

LinkOut - more resources