. 2017 Feb 13:7:42292.
doi: 10.1038/srep42292.

CuII(atsm) improves the neurological phenotype and survival of SOD1G93A mice and selectively increases enzymatically active SOD1 in the spinal cord

Affiliations

CuII(atsm) improves the neurological phenotype and survival of SOD1G93A mice and selectively increases enzymatically active SOD1 in the spinal cord

James B Hilton et al. Sci Rep. .

Abstract

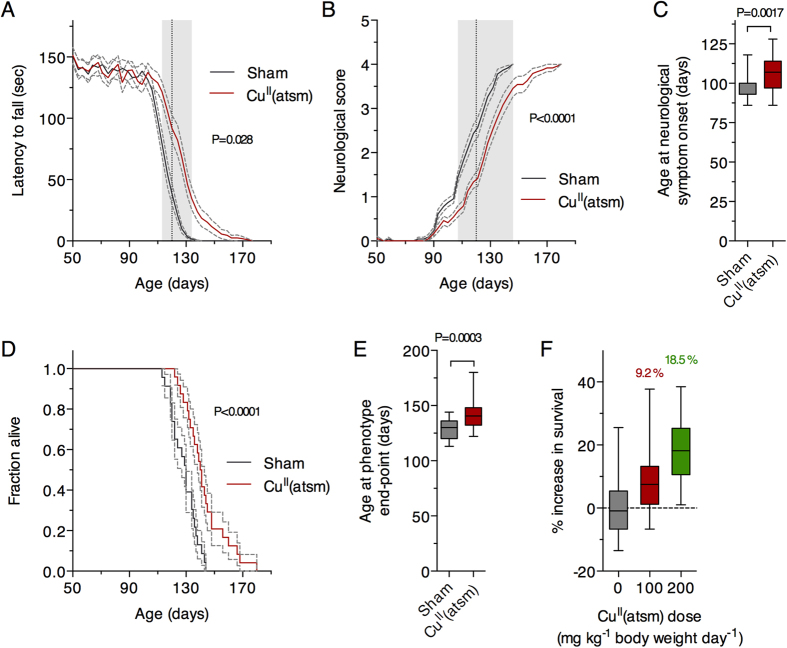
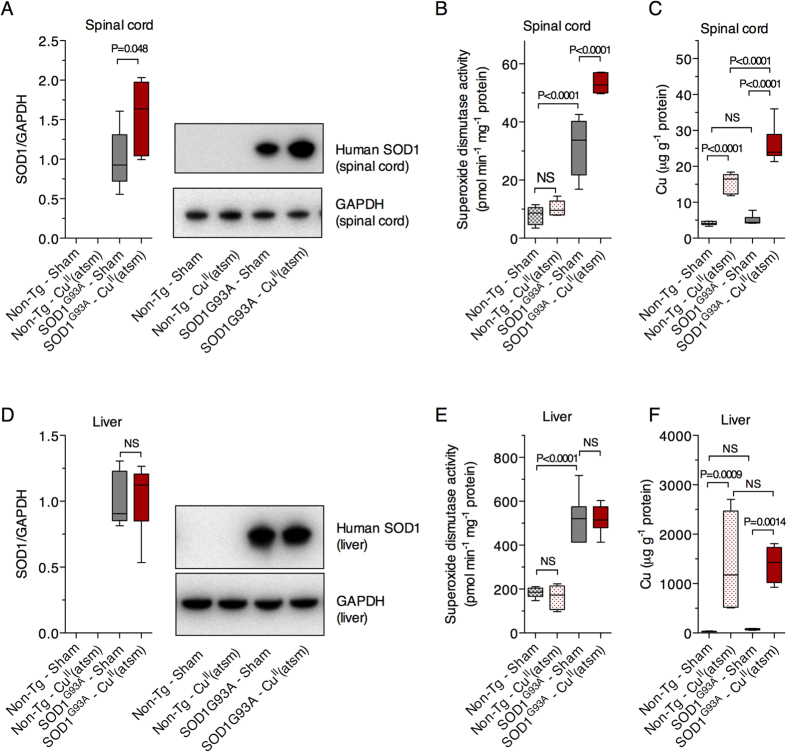
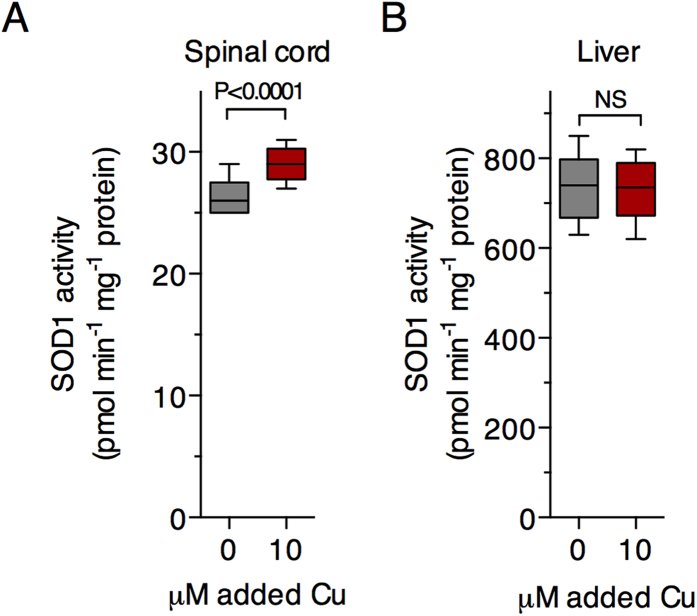
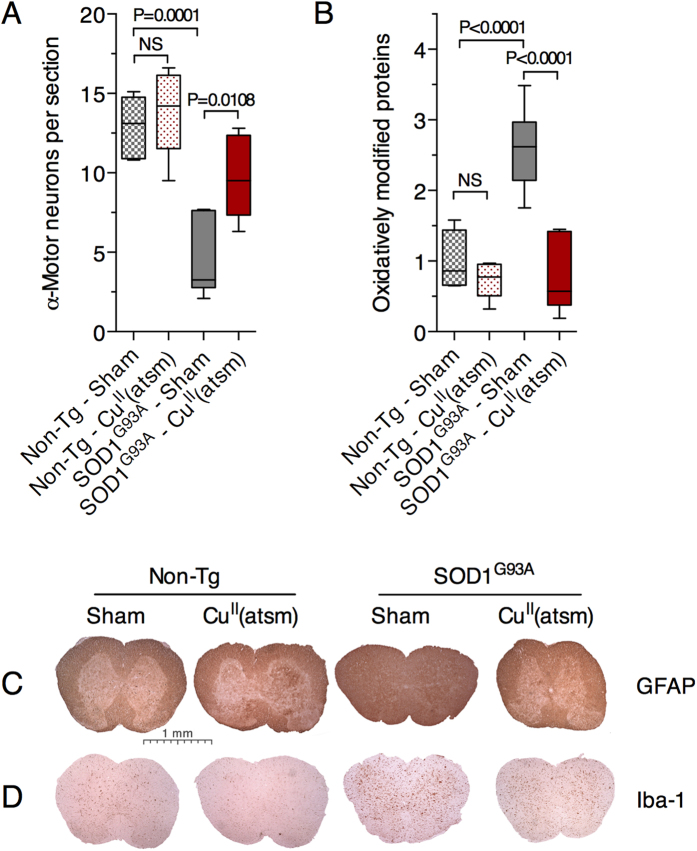
Ubiquitous expression of mutant Cu/Zn-superoxide dismutase (SOD1) selectively affects motor neurons in the central nervous system (CNS), causing the adult-onset degenerative disease amyotrophic lateral sclerosis (ALS). The CNS-specific impact of ubiquitous mutant SOD1 expression is recapitulated in transgenic mouse models of the disease. Here we present outcomes for the metallo-complex CuII(atsm) tested for therapeutic efficacy in mice expressing SOD1G93A on a mixed genetic background. Oral administration of CuII(atsm) delayed the onset of neurological symptoms, improved locomotive capacity and extended overall survival. Although the ALS-like phenotype of SOD1G93A mice is instigated by expression of the mutant SOD1, we show the improved phenotype of the CuII(atsm)-treated animals involves an increase in mature mutant SOD1 protein in the disease-affected spinal cord, where concomitant increases in copper and SOD1 activity are also evident. In contrast to these effects in the spinal cord, treating with CuII(atsm) had no effect in liver on either mutant SOD1 protein levels or its activity, indicating a CNS-selective SOD1 response to the drug. These data provide support for CuII(atsm) as a treatment option for ALS as well as insight to the CNS-selective effects of mutant SOD1.


Conflict of interest statement

Collaborative Medicinal Development has licensed IP pertaining to CuII(atsm) from the University of Melbourne where the inventors include ARW and PSD.

Figures

Figure 1
Figure 1. Effect of orally administered CuII(atsm) on neurological phenotype and survival of SOD1G93A mice.
(A) Performance of sham- and CuII(atsm)-treated SOD1G93A mice on the rotarod test for locomotive function and (B) assessment for neurological symptoms via Neurological Score. (C) Age of symptom onset defined as an individual mouse attaining a score of 1 in the Neurological Score system. (D) Survival to phenotype end-point curves for sham- and CuII(atsm)-treated SOD1G93A mice and (E) box and whisker plots showing the overall treatment effect on survival. (F) Relationship between total daily dose of CuII(atsm) and percentage increase in mean survival. Data for the 100 mg dose are calculated from experiment presented in (D) (mean = 143 days, n = 24), data for the 200 mg dose calculated from experiments in Williams et al. (mean = 155 days, n = 20), and data for the 0 mg dose calculated across the two studies (mean = 131 days, n = 44). Solid lines in (A and B) are mean values. Grey dashed lines in (A,B and D) represent SEM. Data in (C,E and F) are presented as box (median ± 95% CI) and whisker (maximum and minimum) plots. P values in (A and B) represent statistical significance of the treatment effect (repeat measures ANOVA), whereas grey shaded boxes indicate periods for statistically significant differences between mean values for sham- and CuII(atsm)-treated mice (Sidak’s multiple comparisons test). P values in (C and E) indicate a statistically significant difference between mean values for sham- and CuII(atsm)-treated mice (unpaired t-test). P value in (D) represents statistically significant treatment effect (Cox proportional hazards model). Percentage values in F represent mean increase in survival for each CuII(atsm) dose. For A-E, n = 23 sham-treated mice and n = 24 CuII(atsm)-treated mice (treatments administered twice daily by gavage with CuII(atsm) administered per dose at 50 mg kg−1 mouse body weight). Vertical dashed lines in A and B represent the age at which a separate cohort of mice was killed for biochemical analyses.
Figure 2
Figure 2. The effect of orally administered CuII(atsm) on mutant SOD1 and Cu levels in spinal cords and livers of SOD1G93A mice.
Relative abundance of mutant SOD1 protein in spinal cord (A) and liver (D) samples determined via western blot using an antibody that detects only human SOD1. Mutant SOD1 protein levels are expressed relative to the loading control GAPDH. Representative western blot images are shown. SOD1 activity in TBS-soluble extracts from mouse spinal cords (B) and livers (E) presented as pmol superoxide decay min−1 mg−1 tissue protein. The amount of Cu g−1 protein in spinal cord (C) and liver (F) tissue. Treatments were administered twice daily by gavage and commenced when the mice were 50 days old. CuII(atsm) administered per dose was 50 mg kg−1 mouse body weight. Mice were killed at 120 days old to collect tissues for analysis. Graphed data are box (median ± 95% CI) and whisker (maximum and minimum) plots and P value represents statistically significant treatment effect on mean values (unpaired t-test in (A and D) or one-way ANOVA with Tukey’s multiple comparisons test in (B,C,E and F)). NS = not statistically different. For all data shown, n = 6 mice per treatment group.
Figure 3
Figure 3. The effects of adding Cu2+ directly to tissue extracts from SOD1G93A mice on SOD1 activity.
SOD1 activity in TBS-soluble extracts from SOD1G93A mouse spinal cords (A) and livers (B) presented as pmol superoxide decay min−1 mg−1 tissue protein. Tissue extracts were prepared from untreated SOD1G93A mice killed at 120 days old. All data are presented as box (median ± 95% CI) and whisker (maximum and minimum) plots and P values represent statistically significant differences between mean values for indicated groups (paired t-test). NS = not statistically different. For all data shown, n = 6 mice per treatment group.
Figure 4
Figure 4. Effect of orally administered CuII(atsm) on mitochondrial cytochrome c oxidase and citrate synthase activity in SOD1G93A mice.
(A) Cytochrome c oxidase activity in non-transgenic and SOD1G93A mouse spinal cords presented as nmol cytochrome c oxidised min−1 mg−1 tissue protein. (B) Citrate synthase activity in non-transgenic and SOD1G93A mouse spinal cords presented as nmol DTNB reduced min−1 mg−1 tissue protein. Treatments were administered twice daily by gavage and commenced when the mice were 50 days old. CuII(atsm) administered per dose was 50 mg kg−1 mouse body weight. Mice were killed at 120 days old to collect tissues for analysis. Graphed data are box (median ± 95% CI) and whisker (maximum and minimum) plots. No statistically significant differences exist between any of the treatment groups (one-way ANOVA with Tukey’s multiple comparisons test). For all data shown, n = 6 mice per treatment group.
Figure 5
Figure 5. Effect of orally administered CuII(atsm) on α-motor neurons, oxidative damage and astrogliosis in spinal cords of SOD1G93A mice.
(A) Quantitation of α-motor neurons per section in both ventral horn regions of spinal cord sections determined via cresyl violet staining. Only motor neurons with a diameter equivalent to 20 μm or greater were counted. (B) Abundance of oxidatively modified proteins determined using the OxyBlot assay in spinal cord tissue expressed relative to levels detected in sham-treated non-transgenic controls. Representative histology images for GFAP (C) and Iba-1 (D) immunoreactivity in spinal cord transverse sections. Data in (A and B) are presented as box (median ± 95% CI) and whisker (maximum and minimum) plots. P values represent statistically significant differences between mean values for indicated groups (one-way ANOVA with Tukey’s multiple comparisons test, n = 6 mice per treatment group). NS = not statistically different.

References

    1. Renton A. E., Chio A. & Traynor B. J. State of play in amyotrophic lateral sclerosis genetics. Nat. Neurosci. 17, 17–23 (2014). - PMC - PubMed
    1. Rosen D. R. et al.. Mutations in Cu/Zn superoxide dismutase gene are associated with familial amyotrophic lateral sclerosis. Nature 362, 59–62 (1993). - PubMed
    1. Gurney M. E. et al.. Motor neuron degeneration in mice that express a human Cu,Zn superoxide dismutase mutation. Science 264, 1772–1775 (1994). - PubMed
    1. Wong P. C. et al.. An adverse property of a familial ALS-linked SOD1 mutation causes motor neuron disease characterized by vacuolar degeneration of mitochondria. Neuron 14, 1105–1116 (1995). - PubMed
    1. Gingras B. A., Suprunchuk T. & Bayley C. H. The preparation of some thiosemicarbazones and their copper complexes: Part III. Can. J. Chem. 40, 1053–1059 (1962).

Publication types

MeSH terms