

Concentration-Dependent Antagonism and Culture Conversion in Pulmonary Tuberculosis
- PMID: 28205671
- PMCID: PMC5411399
- DOI: 10.1093/cid/cix158
Concentration-Dependent Antagonism and Culture Conversion in Pulmonary Tuberculosis
Erratum in
-
Erratum.Clin Infect Dis. 2017 Oct 15;65(8):1431-1433. doi: 10.1093/cid/cix563. Clin Infect Dis. 2017. PMID: 29017252 Free PMC article. No abstract available.
Abstract
Background: There is scant evidence to support target drug exposures for optimal tuberculosis outcomes. We therefore assessed whether pharmacokinetic/pharmacodynamic (PK/PD) parameters could predict 2-month culture conversion.
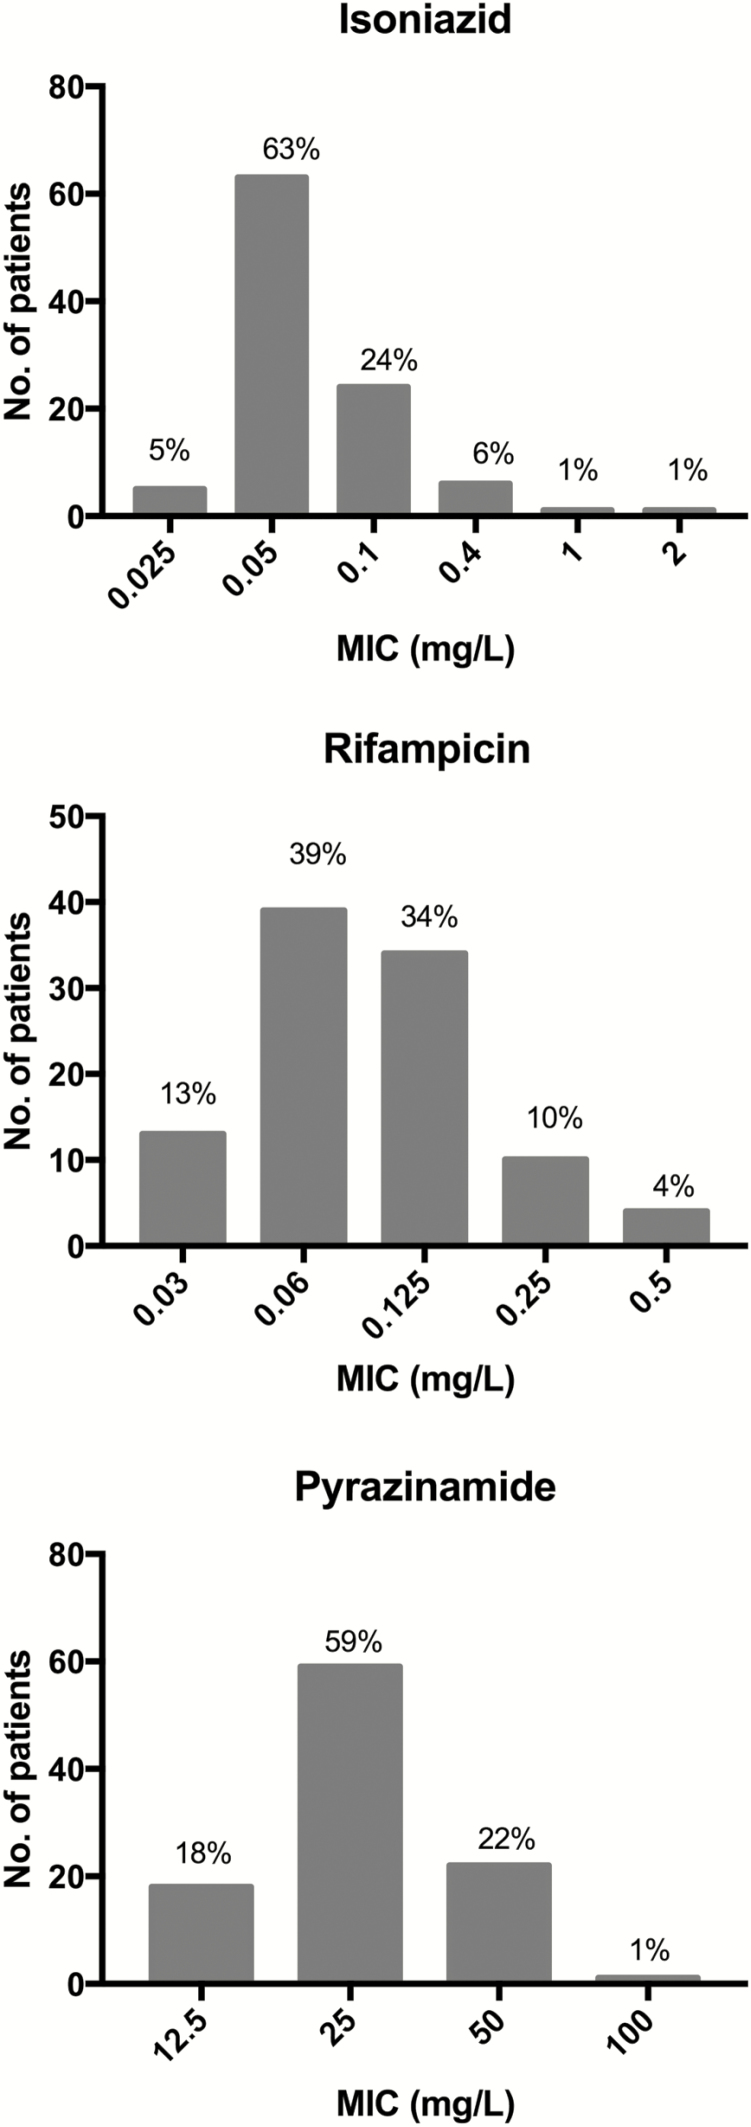
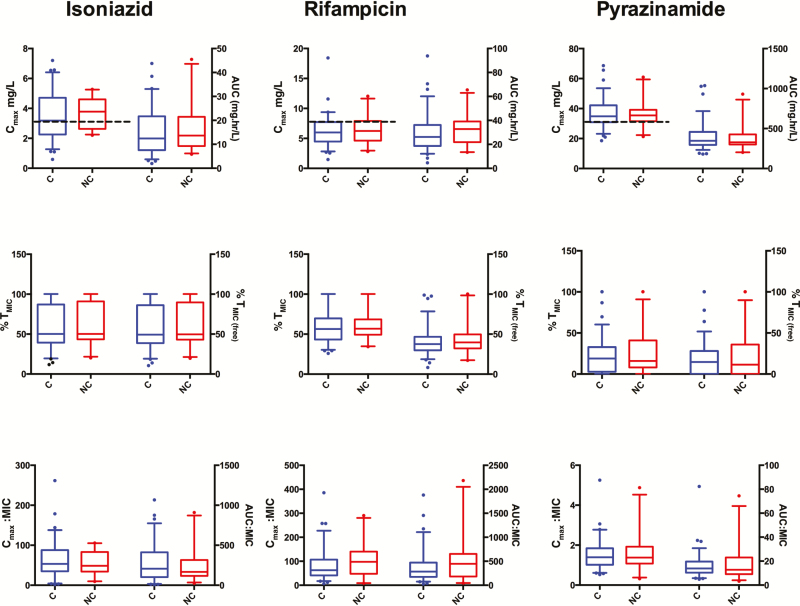
Methods: One hundred patients with pulmonary tuberculosis (65% human immunodeficiency virus coinfected) were intensively sampled to determine rifampicin, isoniazid, and pyrazinamide plasma concentrations after 7-8 weeks of therapy, and PK parameters determined using nonlinear mixed-effects models. Detailed clinical data and sputum for culture were collected at baseline, 2 months, and 5-6 months. Minimum inhibitory concentrations (MICs) were determined on baseline isolates. Multivariate logistic regression and the assumption-free multivariate adaptive regression splines (MARS) were used to identify clinical and PK/PD predictors of 2-month culture conversion. Potential PK/PD predictors included 0- to 24-hour area under the curve (AUC0-24), maximum concentration (Cmax), AUC0-24/MIC, Cmax/MIC, and percentage of time that concentrations persisted above the MIC (%TMIC).
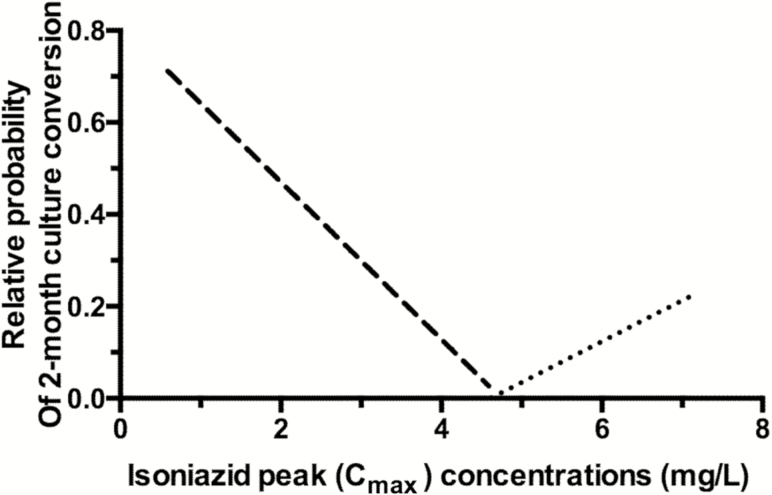
Results: Twenty-six percent of patients had Cmax of rifampicin <8 mg/L, pyrazinamide <35 mg/L, and isoniazid <3 mg/L. No relationship was found between PK exposures and 2-month culture conversion using multivariate logistic regression after adjusting for MIC. However, MARS identified negative interactions between isoniazid Cmax and rifampicin Cmax/MIC ratio on 2-month culture conversion. If isoniazid Cmax was <4.6 mg/L and rifampicin Cmax/MIC <28, the isoniazid concentration had an antagonistic effect on culture conversion. For patients with isoniazid Cmax >4.6 mg/L, higher isoniazid exposures were associated with improved rates of culture conversion.
Conclusions: PK/PD analyses using MARS identified isoniazid Cmax and rifampicin Cmax/MIC thresholds below which there is concentration-dependent antagonism that reduces 2-month sputum culture conversion.
Keywords: Mycobacterium tuberculosis; drug–drug antagonism.; minimum inhibitory concentrations; pharmacokinetic-pharmacodynamic variability; tuberculosis treatment outcomes.
© The Author 2017. Published by Oxford University Press for the Infectious Diseases Society of America.
Figures
References
-
- World Health Organization. Global tuberculosis report 2015. Available at: http://www.who.int/tb/publications/global_report/gtbr2015_executive_summ... Accessed 6 June 2016.
-
- Mitchison DA, Nunn AJ. Influence of initial drug resistance on the response to short-course chemotherapy of pulmonary tuberculosis. Am Rev Respir Dis 1986; 133:423–30. - PubMed
-
- Burman WJ. The hunt for the elusive surrogate marker of sterilizing activity in tuberculosis treatment. Am J Respir Crit Care Med 2003; 167:1299–301. - PubMed
MeSH terms
Substances
Grants and funding
LinkOut - more resources
Full Text Sources
Other Literature Sources
Medical
Miscellaneous
