

Competition between cyanobacteria and green algae at low versus elevated CO2: who will win, and why?
- PMID: 28207058
- PMCID: PMC5853874
- DOI: 10.1093/jxb/erx027
Competition between cyanobacteria and green algae at low versus elevated CO2: who will win, and why?
Abstract
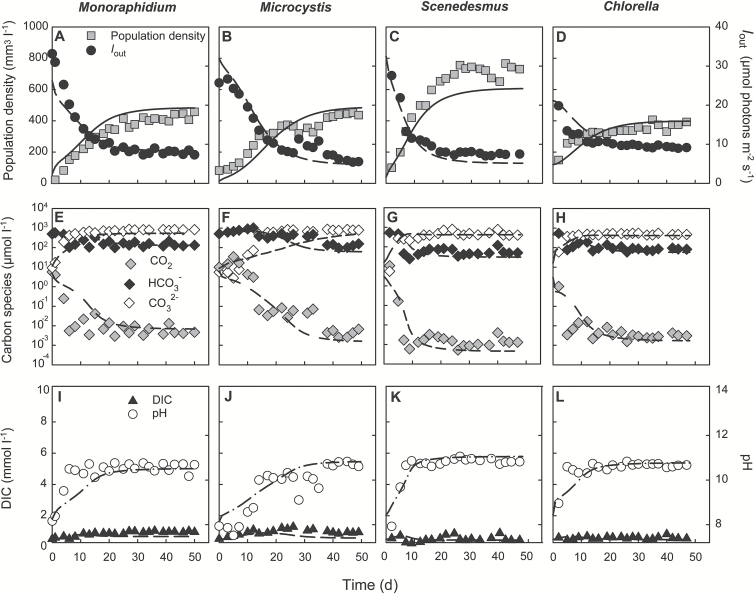
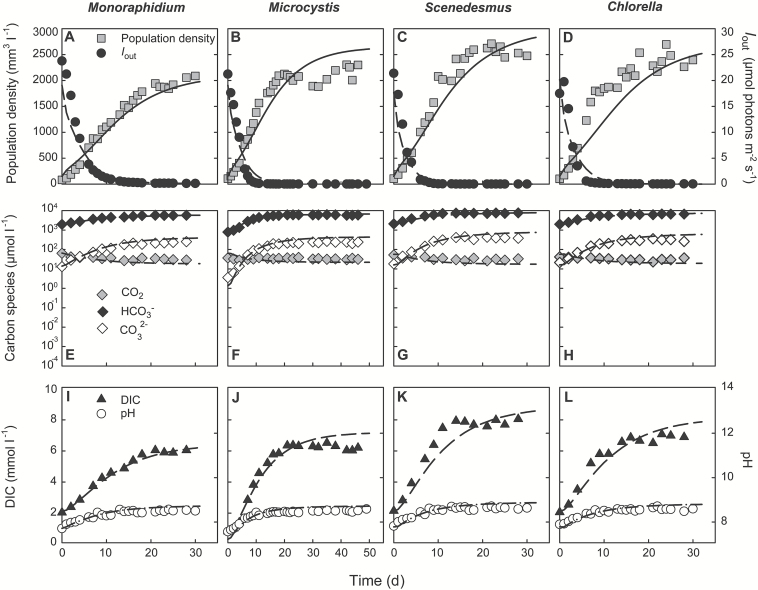
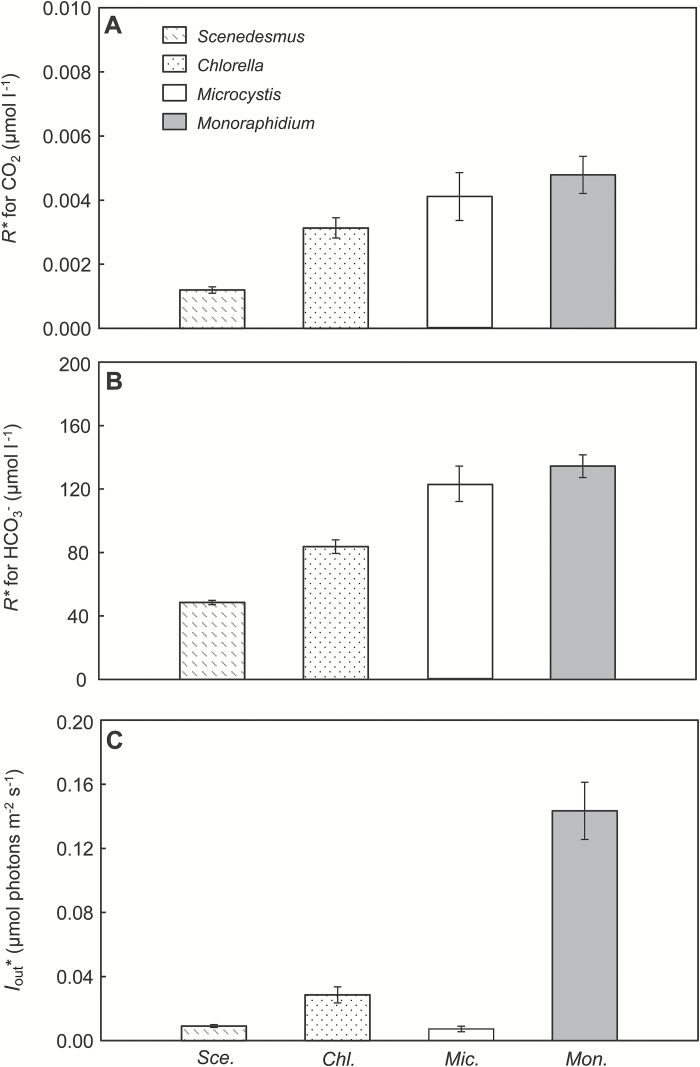
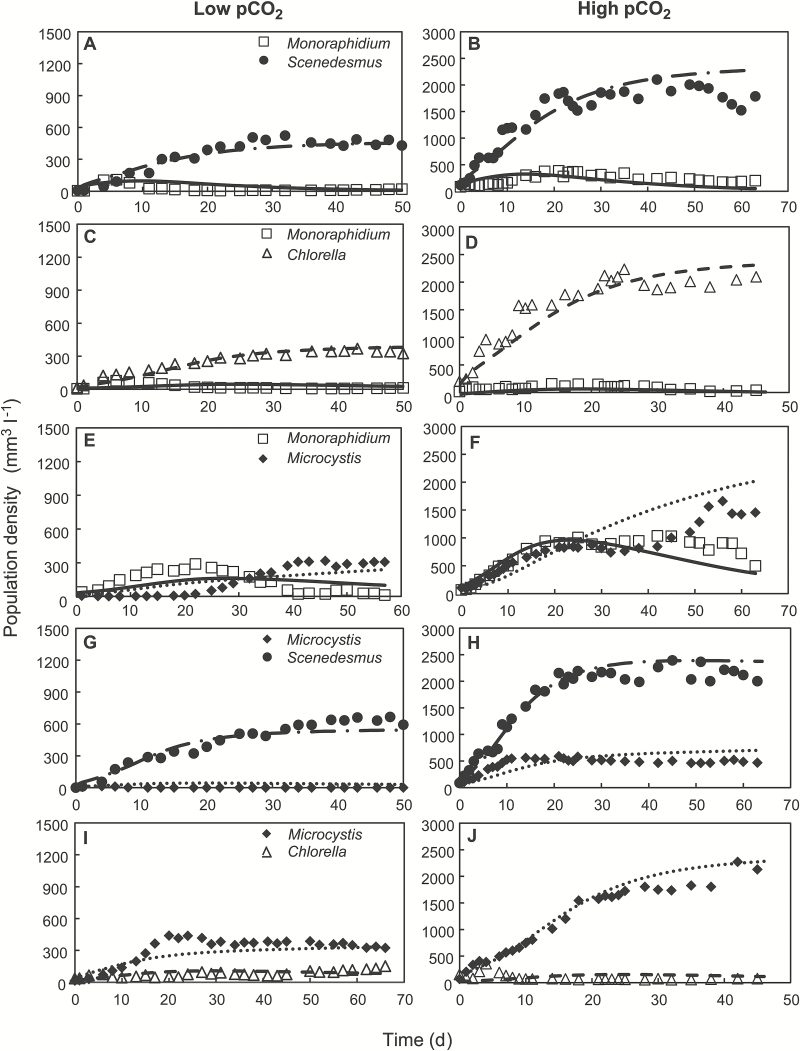
Traditionally, it has often been hypothesized that cyanobacteria are superior competitors at low CO2 and high pH in comparison with eukaryotic algae, owing to their effective CO2-concentrating mechanism (CCM). However, recent work indicates that green algae can also have a sophisticated CCM tuned to low CO2 levels. Conversely, cyanobacteria with the high-flux bicarbonate uptake system BicA appear well adapted to high inorganic carbon concentrations. To investigate these ideas we studied competition between three species of green algae and a bicA strain of the harmful cyanobacterium Microcystis aeruginosa at low (100 ppm) and high (2000 ppm) CO2. Two of the green algae were competitively superior to the cyanobacterium at low CO2, whereas the cyanobacterium increased its competitive ability with respect to the green algae at high CO2. The experiments were supported by a resource competition model linking the population dynamics of the phytoplankton species with dynamic changes in carbon speciation, pH and light. Our results show (i) that competition between phytoplankton species at different CO2 levels can be predicted from species traits in monoculture, (ii) that green algae can be strong competitors under CO2-depleted conditions, and (iii) that bloom-forming cyanobacteria with high-flux bicarbonate uptake systems will benefit from elevated CO2 concentrations.
Keywords: CO2-concentrating mechanism; Carbon dioxide; Microcystis aeruginosa; climate change; competition model; cyanobacteria; green algae; harmful algal blooms; lakes.
© The Author 2017. Published by Oxford University Press on behalf of the Society for Experimental Biology.
Figures
Comment in
-
Cyanobacteria vs green algae: which group has the edge?J Exp Bot. 2017 Jun 1;68(14):3697-3699. doi: 10.1093/jxb/erx226. J Exp Bot. 2017. PMID: 28911057 Free PMC article.
References
-
- Badger MR, Price GD, Long BM, Woodger FJ. 2006. The environmental plasticity and ecological genomics of the cyanobacterial CO2 concentrating mechanism. Journal of Experimental Botany 57, 249–265. - PubMed
-
- Balmer MB, Downing JA. 2011. Carbon dioxide concentrations in eutrophic lakes: undersaturation implies atmospheric uptake. Inland Waters 1, 125–132.
-
- Beardall J. 1991. Effects of photon flux density on the ‘CO2-concentrating mechanism’ of the cyanobacterium Anabaena variabilis. Journal of Plankton Research 13, 133–141.
-
- Beardall J, Giordano M. 2002. Ecological implications of microalgal and cyanobacterial CO2 concentrating mechanisms, and their regulation. Functional Plant Biology 29, 335–347. - PubMed
-
- Beklioglu M, Moss B. 1995. The impact of pH on interactions among phytoplankton algae, zooplankton and perch (Perca fluviatilis) in a shallow, fertile lake. Freshwater Biology 33, 497–509.
Publication types
MeSH terms
Substances
LinkOut - more resources
Full Text Sources
Other Literature Sources
Miscellaneous
