

Measuring Socioeconomic Inequalities With Predicted Absolute Incomes Rather Than Wealth Quintiles: A Comparative Assessment Using Child Stunting Data From National Surveys
- PMID: 28207339
- PMCID: PMC5343715
- DOI: 10.2105/AJPH.2017.303657
Measuring Socioeconomic Inequalities With Predicted Absolute Incomes Rather Than Wealth Quintiles: A Comparative Assessment Using Child Stunting Data From National Surveys
Abstract
Objectives: To compare the predictive power of synthetic absolute income measures with that of asset-based wealth quintiles in low- and middle-income countries (LMICs) using child stunting as an outcome.
Methods: We pooled data from 239 nationally representative household surveys from LMICs and computed absolute incomes in US dollars based on households' asset rank as well as data on national consumption and inequality levels. We used multivariable regression models to compare the predictive power of the created income measure with the predictive power of existing asset indicator measures.
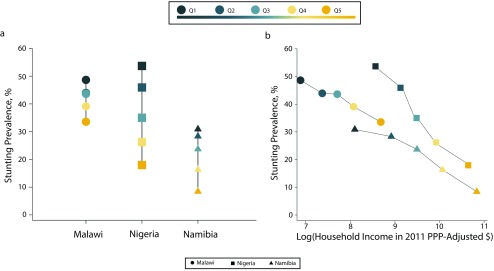
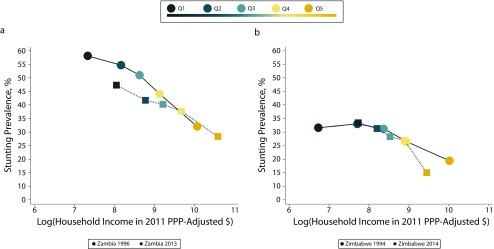
Results: In cross-country analysis, log absolute income predicted 54.5% of stunting variation observed, compared with 20% of variation explained by wealth quintiles. For within-survey analysis, we also found absolute income gaps to be predictive of the gaps between stunting in the wealthiest and poorest households (P < .001).
Conclusions: Our results suggest that absolute income levels can greatly improve the prediction of stunting levels across and within countries over time, compared with models that rely solely on relative wealth quintiles.
Figures
References
-
- Filmer D, Pritchett LH. Estimating wealth effects without expenditure data—or tears: an application to educational enrollments in states of India. Demography. 2001;38(1):115–132. - PubMed
-
- Harttgen K, Vollmer S. Using an asset index to simulate household income. Econ Lett. 2013;121(2):257–262.
-
- Black RE, Victora CG, Walker SP et al. Maternal and child undernutrition and overweight in low-income and middle-income countries. Lancet. 2013;382(9890):427–451. - PubMed
-
- World Income Inequality Database (WIID3c) 2015. Available at: https://www.wider.unu.edu/project/wiid-world-income-inequality-database. Accessed June 16, 2016.
-
- World Bank. World Development Indicators online database. 2016. Available at: http://databank.worldbank.org/data/reports.aspx?source=world-development.... Accessed June 16, 2016.
Publication types
MeSH terms
LinkOut - more resources
Full Text Sources
Other Literature Sources
Medical
