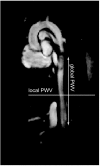
Local versus global aortic pulse wave velocity in early atherosclerosis: An animal study in ApoE-/--mice using ultrahigh field MRI
- PMID: 28207773
- PMCID: PMC5313136
- DOI: 10.1371/journal.pone.0171603
Local versus global aortic pulse wave velocity in early atherosclerosis: An animal study in ApoE-/--mice using ultrahigh field MRI
Abstract
Increased aortic stiffness is known to be associated with atherosclerosis and has a predictive value for cardiovascular events. This study aims to investigate the local distribution of early arterial stiffening due to initial atherosclerotic lesions. Therefore, global and local pulse wave velocity (PWV) were measured in ApoE-/- and wild type (WT) mice using ultrahigh field MRI. For quantification of global aortic stiffness, a new multi-point transit-time (TT) method was implemented and validated to determine the global PWV in the murine aorta. Local aortic stiffness was measured by assessing the local PWV in the upper abdominal aorta, using the flow/area (QA) method. Significant differences between age matched ApoE-/- and WT mice were determined for global and local PWV measurements (global PWV: ApoE-/-: 2.7±0.2m/s vs WT: 2.1±0.2m/s, P<0.03; local PWV: ApoE-/-: 2.9±0.2m/s vs WT: 2.2±0.2m/s, P<0.03). Within the WT mouse group, the global PWV correlated well with the local PWV in the upper abdominal aorta (R2 = 0.75, P<0.01), implying a widely uniform arterial elasticity. In ApoE-/- animals, however, no significant correlation between individual local and global PWV was present (R2 = 0.07, P = 0.53), implying a heterogeneous distribution of vascular stiffening in early atherosclerosis. The assessment of global PWV using the new multi-point TT measurement technique was validated against a pressure wire measurement in a vessel phantom and showed excellent agreement. The experimental results demonstrate that vascular stiffening caused by early atherosclerosis is unequally distributed over the length of large vessels. This finding implies that assessing heterogeneity of arterial stiffness by multiple local measurements of PWV might be more sensitive than global PWV to identify early atherosclerotic lesions.
Conflict of interest statement
Figures


Similar articles
-
Assessment of local pulse wave velocity distribution in mice using k-t BLAST PC-CMR with semi-automatic area segmentation.J Cardiovasc Magn Reson. 2017 Oct 16;19(1):77. doi: 10.1186/s12968-017-0382-2. J Cardiovasc Magn Reson. 2017. PMID: 29037199 Free PMC article.
-
Local arterial stiffening assessed by MRI precedes atherosclerotic plaque formation.Circ Cardiovasc Imaging. 2013 Nov;6(6):916-23. doi: 10.1161/CIRCIMAGING.113.000611. Epub 2013 Oct 7. Circ Cardiovasc Imaging. 2013. PMID: 24100044
-
Simultaneous measurements of 3D wall shear stress and pulse wave velocity in the murine aortic arch.J Cardiovasc Magn Reson. 2021 Mar 18;23(1):34. doi: 10.1186/s12968-021-00725-4. J Cardiovasc Magn Reson. 2021. PMID: 33731147 Free PMC article.
-
[Pulse wave velocity - a useful tool in assessing the stiffness of the arteries].Pol Merkur Lekarski. 2019 Jun 28;46(276):257-262. Pol Merkur Lekarski. 2019. PMID: 31260435 Review. Polish.
-
Role of arterial stiffness in cardiovascular disease.JRSM Cardiovasc Dis. 2012 Jul 31;1(4):cvd.2012.012016. doi: 10.1258/cvd.2012.012016. JRSM Cardiovasc Dis. 2012. PMID: 24175067 Free PMC article. Review.
Cited by
-
2D Projection Maps of WSS and OSI Reveal Distinct Spatiotemporal Changes in Hemodynamics in the Murine Aorta during Ageing and Atherosclerosis.Biomedicines. 2021 Dec 7;9(12):1856. doi: 10.3390/biomedicines9121856. Biomedicines. 2021. PMID: 34944672 Free PMC article.
-
Stiffness of aortic arch and carotid arteries increases in ApoE-knockout mice with high-fat diet: evidence from echocardiography.Am J Transl Res. 2021 Mar 15;13(3):1352-1364. eCollection 2021. Am J Transl Res. 2021. PMID: 33841661 Free PMC article.
-
Diverse application of MRI for mouse phenotyping.Birth Defects Res. 2017 Jun 1;109(10):758-770. doi: 10.1002/bdr2.1051. Epub 2017 May 22. Birth Defects Res. 2017. PMID: 28544650 Free PMC article. Review.
-
Evaluation of Plaque Characteristics and Inflammation Using Magnetic Resonance Imaging.Biomedicines. 2021 Feb 12;9(2):185. doi: 10.3390/biomedicines9020185. Biomedicines. 2021. PMID: 33673124 Free PMC article. Review.
-
Regional assessment of carotid artery pulse wave velocity using compressed sensing accelerated high temporal resolution 2D CINE phase contrast cardiovascular magnetic resonance.J Cardiovasc Magn Reson. 2018 Dec 20;20(1):86. doi: 10.1186/s12968-018-0499-y. J Cardiovasc Magn Reson. 2018. PMID: 30567566 Free PMC article.
References
-
- Ben-Shlomo Y, Spears M, Boustred C, May M, Anderson SG, Benjamin EJ, et al. Aortic pulse wave velocity improves cardiovascular event prediction: an individual participant meta-analysis of prospective observational data from 17,635 subjects. J Am Coll Cardiol. 2014;63(7):636–46. 10.1016/j.jacc.2013.09.063 - DOI - PMC - PubMed
-
- Laurent S, Boutouyrie P, Asmar R, Gautier I, Laloux B, Guize L, et al. Aortic stiffness is an independent predictor of all-cause and cardiovascular mortality in hypertensive patients. Hypertension. 2001;37(5):1236–41. - PubMed
MeSH terms
Substances
LinkOut - more resources
Full Text Sources
Other Literature Sources
Medical
Molecular Biology Databases
Miscellaneous

