

Interacting networks of resistance, virulence and core machinery genes identified by genome-wide epistasis analysis
- PMID: 28207813
- PMCID: PMC5312804
- DOI: 10.1371/journal.pgen.1006508
Interacting networks of resistance, virulence and core machinery genes identified by genome-wide epistasis analysis
Abstract
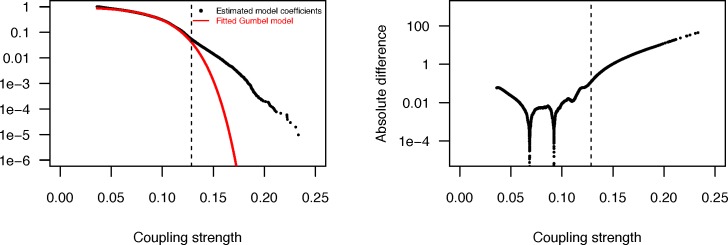
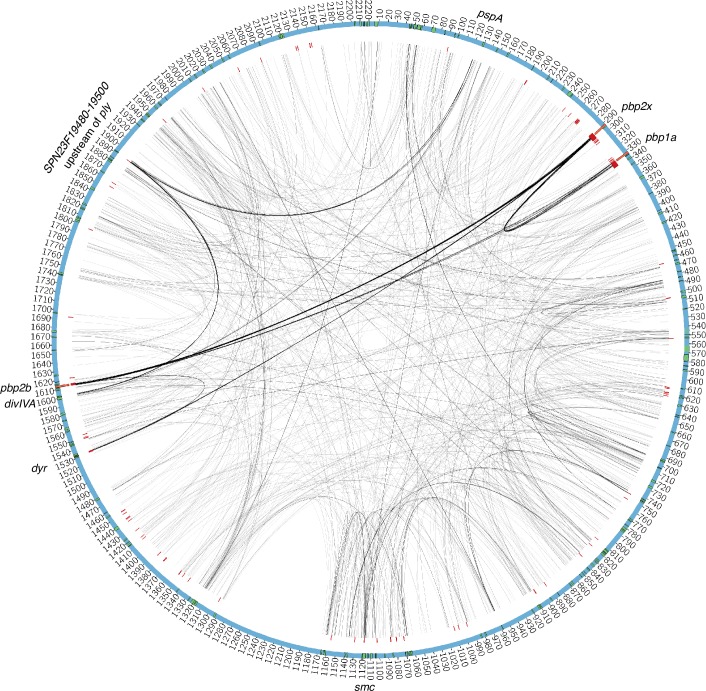
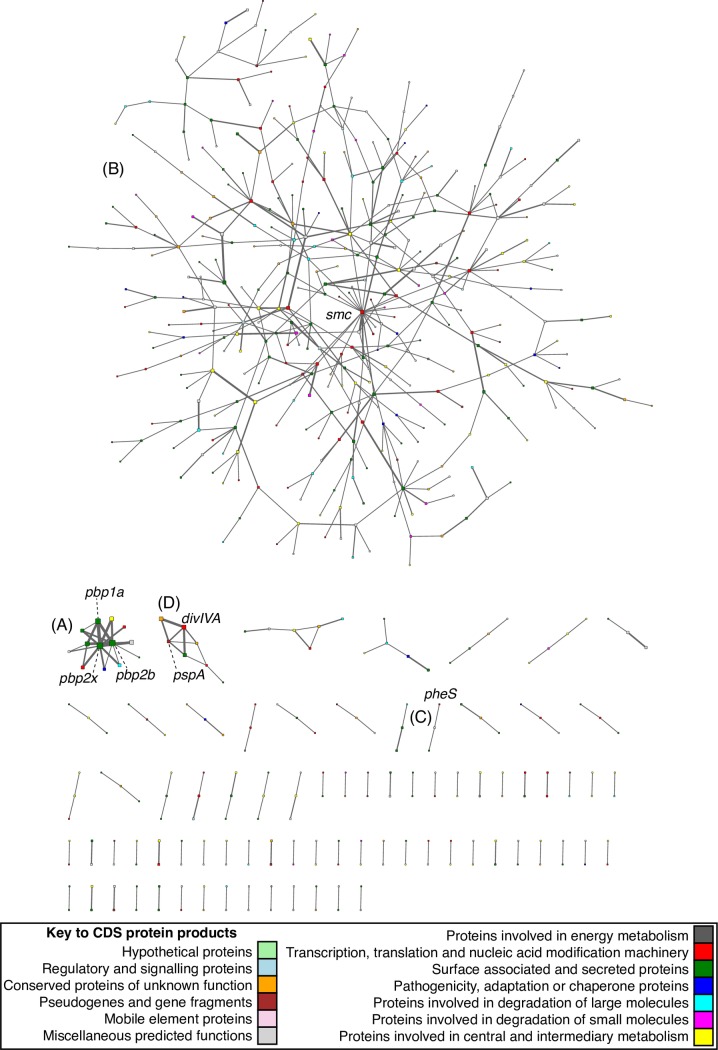
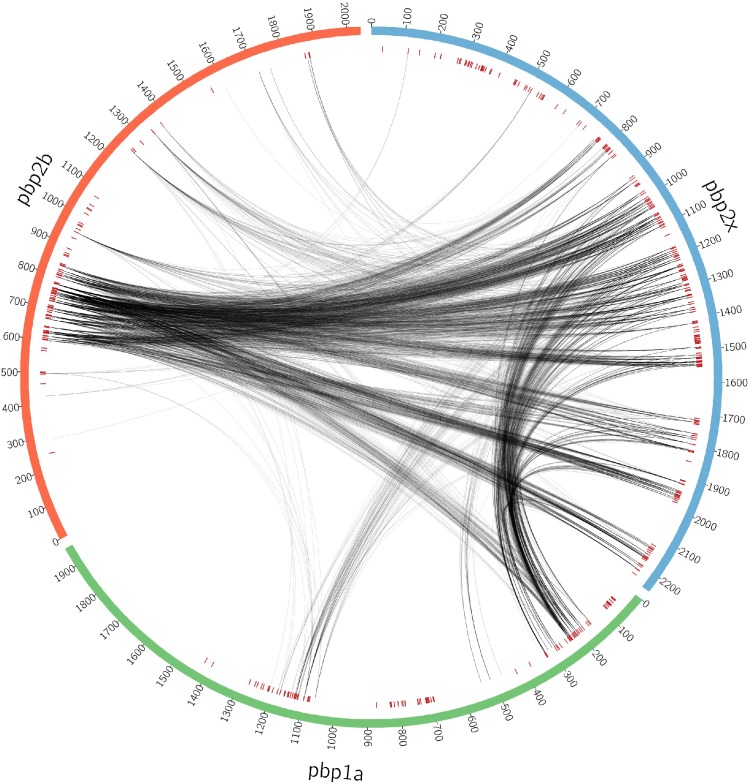
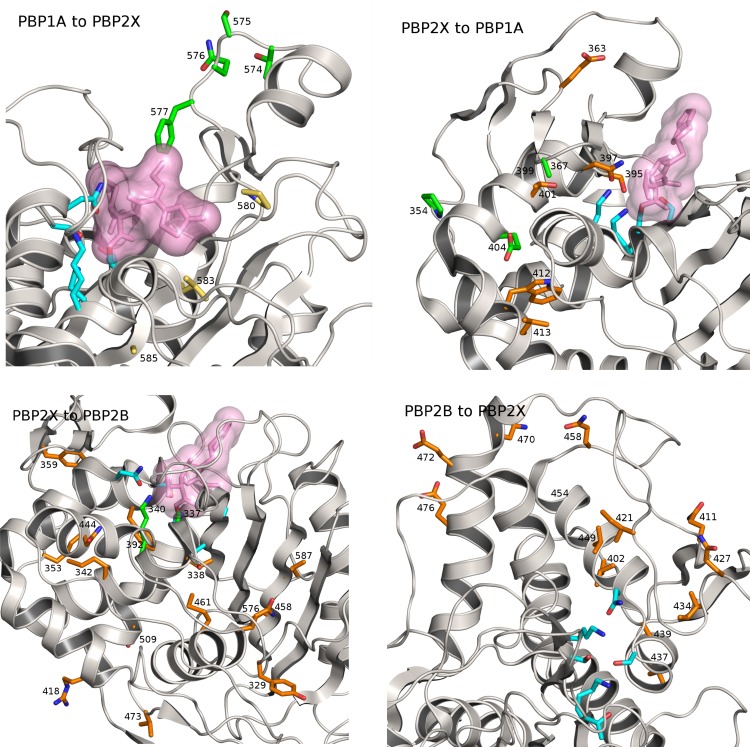
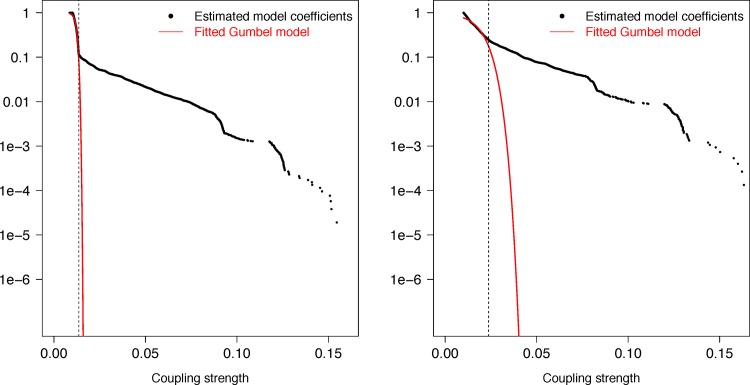
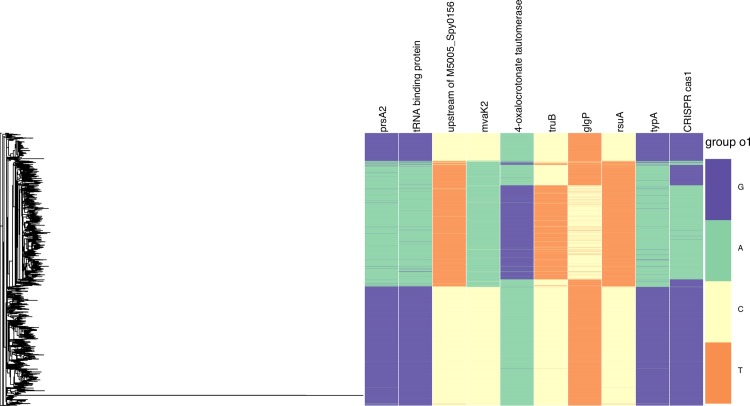
Recent advances in the scale and diversity of population genomic datasets for bacteria now provide the potential for genome-wide patterns of co-evolution to be studied at the resolution of individual bases. Here we describe a new statistical method, genomeDCA, which uses recent advances in computational structural biology to identify the polymorphic loci under the strongest co-evolutionary pressures. We apply genomeDCA to two large population data sets representing the major human pathogens Streptococcus pneumoniae (pneumococcus) and Streptococcus pyogenes (group A Streptococcus). For pneumococcus we identified 5,199 putative epistatic interactions between 1,936 sites. Over three-quarters of the links were between sites within the pbp2x, pbp1a and pbp2b genes, the sequences of which are critical in determining non-susceptibility to beta-lactam antibiotics. A network-based analysis found these genes were also coupled to that encoding dihydrofolate reductase, changes to which underlie trimethoprim resistance. Distinct from these antibiotic resistance genes, a large network component of 384 protein coding sequences encompassed many genes critical in basic cellular functions, while another distinct component included genes associated with virulence. The group A Streptococcus (GAS) data set population represents a clonal population with relatively little genetic variation and a high level of linkage disequilibrium across the genome. Despite this, we were able to pinpoint two RNA pseudouridine synthases, which were each strongly linked to a separate set of loci across the chromosome, representing biologically plausible targets of co-selection. The population genomic analysis method applied here identifies statistically significantly co-evolving locus pairs, potentially arising from fitness selection interdependence reflecting underlying protein-protein interactions, or genes whose product activities contribute to the same phenotype. This discovery approach greatly enhances the future potential of epistasis analysis for systems biology, and can complement genome-wide association studies as a means of formulating hypotheses for targeted experimental work.
Conflict of interest statement
The authors have declared that no competing interests exist.
Figures
Comment in
-
Epistasis Analysis Goes Genome-Wide.PLoS Genet. 2017 Feb 16;13(2):e1006558. doi: 10.1371/journal.pgen.1006558. eCollection 2017 Feb. PLoS Genet. 2017. PMID: 28207740 Free PMC article. No abstract available.
Similar articles
-
[Effects of amino acid substitutions of penicillin-binding proteins 2B, 1A, 2X on minimal inhibitory concentration of beta-lactams against Streptococcus pneumoniae].Zhonghua Er Ke Za Zhi. 2010 Jan;48(1):60-4. Zhonghua Er Ke Za Zhi. 2010. PMID: 20441706 Chinese.
-
Compensatory evolution of pbp mutations restores the fitness cost imposed by β-lactam resistance in Streptococcus pneumoniae.PLoS Pathog. 2011 Feb;7(2):e1002000. doi: 10.1371/journal.ppat.1002000. Epub 2011 Feb 17. PLoS Pathog. 2011. PMID: 21379570 Free PMC article.
-
Integrative Reverse Genetic Analysis Identifies Polymorphisms Contributing to Decreased Antimicrobial Agent Susceptibility in Streptococcus pyogenes.mBio. 2022 Feb 22;13(1):e0361821. doi: 10.1128/mbio.03618-21. Epub 2022 Jan 18. mBio. 2022. PMID: 35038921 Free PMC article.
-
Genomic epidemiology of penicillin-non-susceptible Streptococcus pneumoniae.Microb Genom. 2019 Oct;5(10):e000305. doi: 10.1099/mgen.0.000305. Epub 2019 Oct 14. Microb Genom. 2019. PMID: 31609685 Free PMC article. Review.
-
A review of penicillin binding protein and group A Streptococcus with reduced-β-lactam susceptibility.Front Cell Infect Microbiol. 2023 Mar 31;13:1117160. doi: 10.3389/fcimb.2023.1117160. eCollection 2023. Front Cell Infect Microbiol. 2023. PMID: 37065204 Free PMC article. Review.
Cited by
-
Epistatic control of intrinsic resistance by virulence genes in Listeria.PLoS Genet. 2018 Sep 4;14(9):e1007525. doi: 10.1371/journal.pgen.1007525. eCollection 2018 Sep. PLoS Genet. 2018. PMID: 30180166 Free PMC article.
-
Fine-Scale Haplotype Structure Reveals Strong Signatures of Positive Selection in a Recombining Bacterial Pathogen.Mol Biol Evol. 2020 Feb 1;37(2):417-428. doi: 10.1093/molbev/msz225. Mol Biol Evol. 2020. PMID: 31589312 Free PMC article.
-
Niche-specific genome degradation and convergent evolution shaping Staphylococcus aureus adaptation during severe infections.Elife. 2022 Jun 14;11:e77195. doi: 10.7554/eLife.77195. Elife. 2022. PMID: 35699423 Free PMC article.
-
Identification of potential pathogenic targets and survival strategies of Vibrio vulnificus through population genomics.Front Cell Infect Microbiol. 2023 Aug 25;13:1254379. doi: 10.3389/fcimb.2023.1254379. eCollection 2023. Front Cell Infect Microbiol. 2023. PMID: 37692161 Free PMC article.
-
Global analysis of more than 50,000 SARS-CoV-2 genomes reveals epistasis between eight viral genes.Proc Natl Acad Sci U S A. 2020 Dec 8;117(49):31519-31526. doi: 10.1073/pnas.2012331117. Epub 2020 Nov 17. Proc Natl Acad Sci U S A. 2020. PMID: 33203681 Free PMC article.
References
Publication types
MeSH terms
Substances
Associated data
Grants and funding
LinkOut - more resources
Full Text Sources
Other Literature Sources
