. 2017 Feb 16;12(2):e0172405.
doi: 10.1371/journal.pone.0172405. eCollection 2017.

Structure, kinetic characterization and subcellular localization of the two ribulose 5-phosphate epimerase isoenzymes from Trypanosoma cruzi

Affiliations

Structure, kinetic characterization and subcellular localization of the two ribulose 5-phosphate epimerase isoenzymes from Trypanosoma cruzi

Soledad Natalia Gonzalez et al. PLoS One. .

Abstract

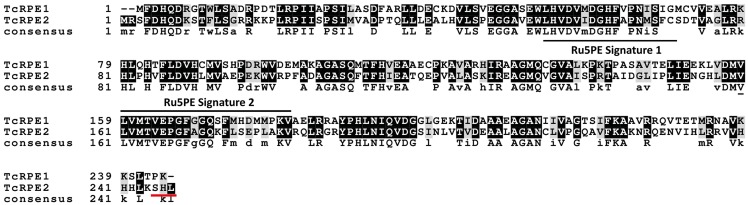
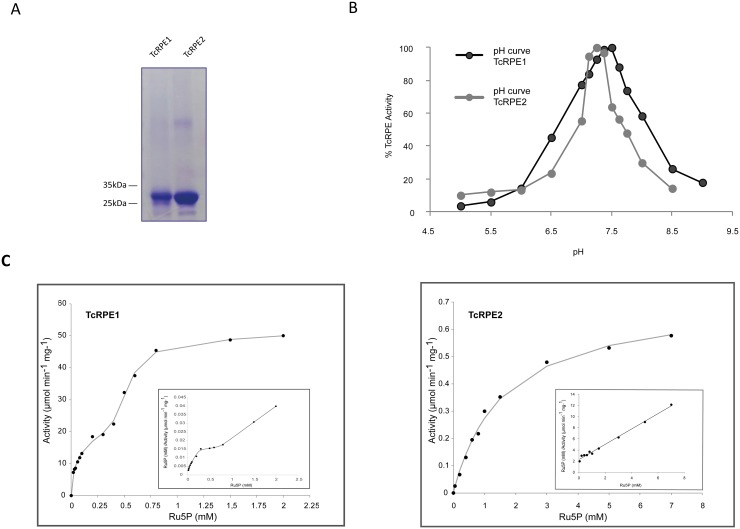
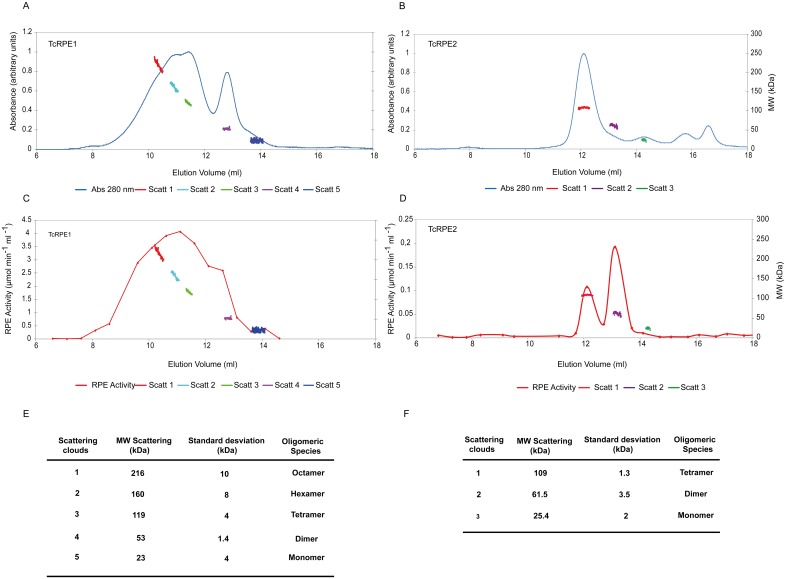
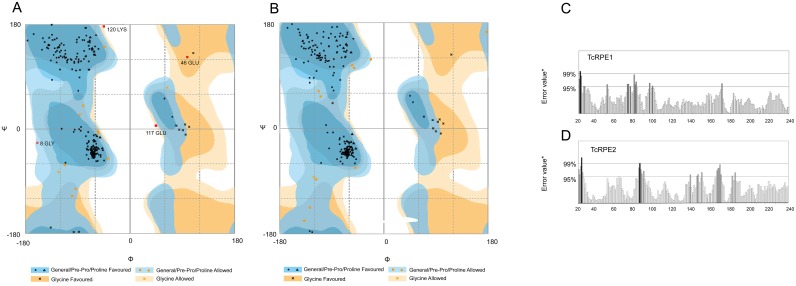
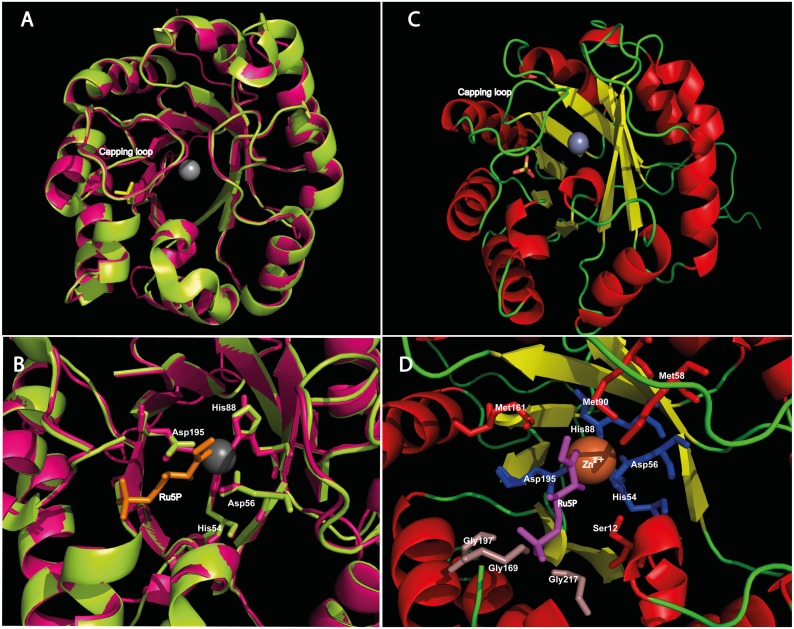
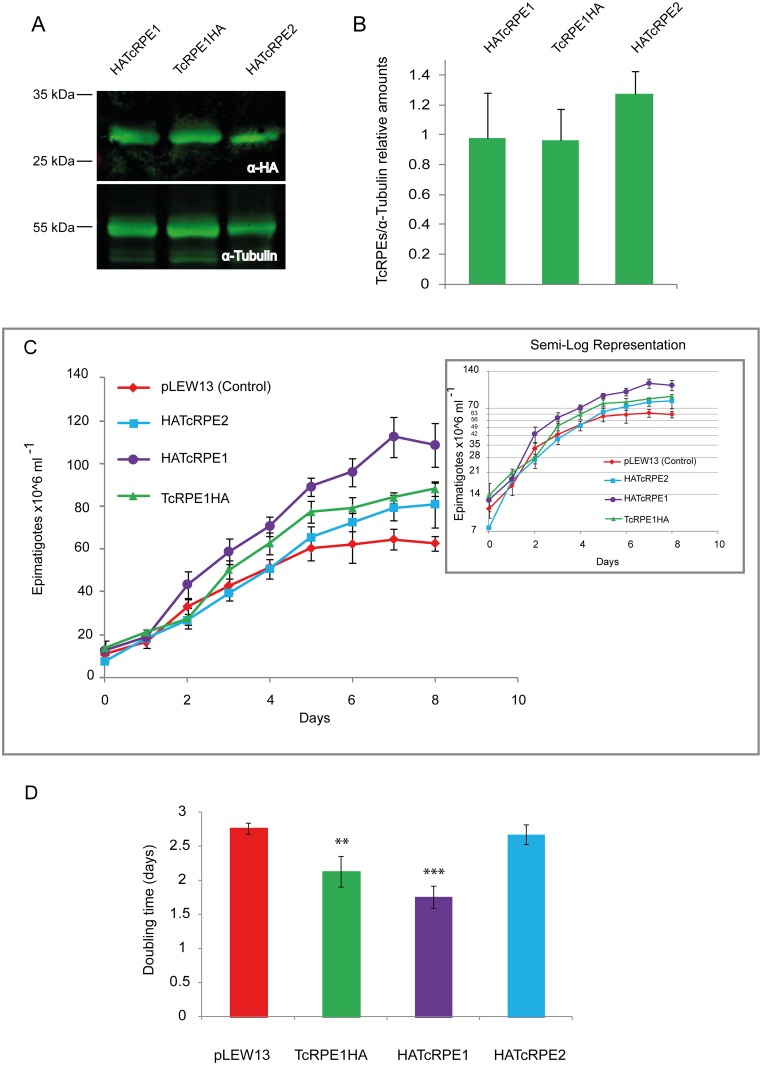
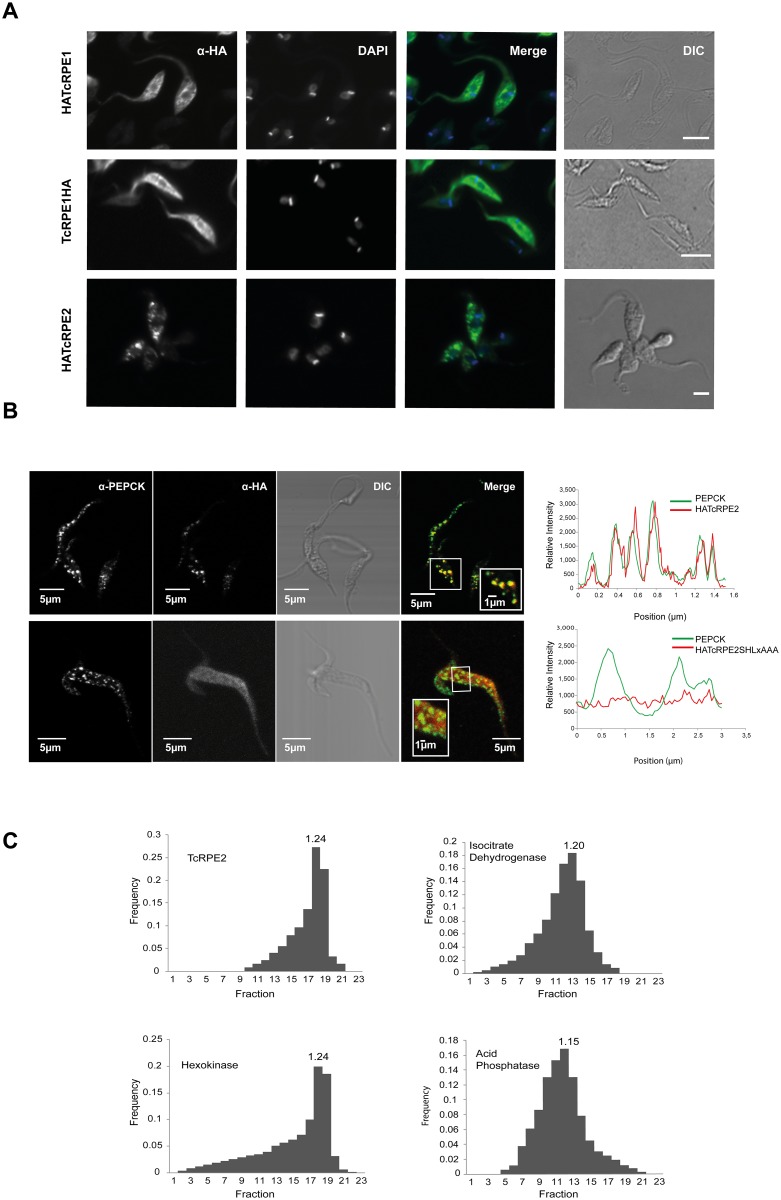
The enzyme of the pentose phosphate pathway (PPP) ribulose-5-phosphate-epimerase (RPE) is encoded by two genes present in the genome of Trypanosoma cruzi CL Brener clone: TcRPE1 and TcRPE2. Despite high sequence similarity at the amino acid residue level, the recombinant isoenzymes show a strikingly different kinetics. Whereas TcRPE2 follows a typical michaelian behavior, TcRPE1 shows a complex kinetic pattern, displaying a biphasic curve, suggesting the coexistence of -at least- two kinetically different molecular forms. Regarding the subcellular localization in epimastigotes, whereas TcRPE1 is a cytosolic enzyme, TcRPE2 is localized in glycosomes. To our knowledge, TcRPE2 is the first PPP isoenzyme that is exclusively localized in glycosomes. Over-expression of TcRPE1, but not of TcRPE2, significantly reduces the parasite doubling time in vitro, as compared with wild type epimastigotes. Both TcRPEs represent single domain proteins exhibiting the classical α/β TIM-barrel fold, as expected for enzymes with this activity. With regard to the architecture of the active site, all the important amino acid residues for catalysis -with the exception of M58- are also present in both TcRPEs models. The superimposition of the binding pocket of both isoenzyme models shows that they adopt essentially identical positions in the active site with a residue specific RMSD < 2Å, with the sole exception of S12, which displays a large deviation (residue specific RMSD: 11.07 Å). Studies on the quaternary arrangement of these isoenzymes reveal that both are present in a mixture of various oligomeric species made up of an even number of molecules, probably pointing to the dimer as their minimal functional unit. This multiplicity of oligomeric species has not been reported for any of the other RPEs studied so far and it might bear implications for the regulation of TcRPEs activity, although further investigation will be necessary to unravel the physiological significance of these structural findings.


Conflict of interest statement

Competing Interests: The authors have declared that no competing interests exist.

Figures

Fig 1
Fig 1. Comparision of amino acid sequences of the RPEs from the CL Brener clone of T.cruzi.
Conservation has been indicated by different tones of grey according to the Boxshade convention (darker grey means more similar residues). At the consensus line, identical residues are represented in uppercase letter and similar residues in lowercase. The PTS glycosomal targeting signal of TcRPE2 is underlined in red and the ribulose 5-phosphate 3’-epimerase family signatures—Ru5PE Signature 1 and Ru5PE Signature 2- are marked with black horizontal lines over and under the letters, respectively.
Fig 2
Fig 2
(A) Recombinant TcRPE1 and TcRPE2 preparations used for enzymatic assays. SDS-PAGE analysis followed by Coomassie Blue staining to assess the purity of the recombinant proteins TcRPE1 and TcRPE2. (B) Relative RPE activity as a function of pH for TcRPE1 and TcRPE2. Acetate, Bis-Tris, Tris-HCl buffer (50 mM each) was used over the complete pH range. Maximal activity was also observed at the same pH values if Tris-HCl or triethanolamine-HCl buffers were used instead. (C) Plot of RPE specific activity as a function of the concentration of the substrate Ru5P for TcRPE1 and TcRPE2. While TcRPE2 presents a typical hyperbolic response, TcRPE1 shows a very complex kinetic behavior to increasing concentrations of Ru5P. One of four independent experiments is shown as an example for each isoenzyme. The Hanes-Woolf plot is shown as an inset at the lower right of each panel. The experimental points shown are the mean of two determinations.
Fig 3
Fig 3. Each TcRPE displays a complex oligomeric composition.
Panels A, C and B, D correspond to TcRPE1 and TcRPE2, respectively. Absorbance at 280 (thin blue line), molecular mass in kDa estimated by LS (clouds points of different color) and RPE activity (thin red line). Panels E and F summarize in tabular form the different oligomeric states found for TcRPE1 and TcRPE2, respectively.
Fig 4
Fig 4. Overall Ramachandran and Errat plots for the refined models of TcRPE1 (A, C) and TcRPE2 (B, D).
Fig 5
Fig 5
(A) Ribbon representation of the superimposition between the model for TcRPE1 (in magenta) and its template 1TQX (in lemon green). The coordinated zinc ion is shown as a grey sphere and the bound sulfate ion is represented in yellow sticks. (B) Zoom view of the superimposition of the active site, showing the catalytic tetrad in stick representation. Ru5P is represented in orange sticks. (C) Ribbon depiction of the overall structure of the TcRPE1 model: the central β-sheet core is shown in yellow, the αβ loops in green, and the α-helices in red. (D) Zoom view on the active site of the model for TcRPE1, where the catalytic tetrad is shown in blue, and residues involved in substrate docking are shown in grey and red sticks. Ru5P is painted in purple.
Fig 6
Fig 6. HATcRPE1 and TcRPE1HA over-expression enhances the growth of T. cruzi CL Brener epimastigotes.
(A) Equal amounts of total cell free extracts from HATcRPE1, TcRPE1HA, and HATcRPE2 CL Brener [pLEW13] lines after 72h induction with 5 μg/ ml tetracycline were loaded on SDS PAGE followed by Western blot analysis using rat anti-HA monoclonal antibodies (α-HA) and mouse anti-tubulin antibodies (α-tubulin). (B) The intensity of the HATcRPE1, TcRPE1HA and HATcRPE2 bands was quantified in three independent experiments and normalized to α-tubulin intensity. The bar graph represents the mean ± SEM of the relative intensity of the bands. (C) Growth curves of pLEW13 (control), HATcRPE1, TcRPE1HA and HATcRPE2 strains under tetracycline induction. One of four independent experiments is shown as an example. The semi-log growth is shown as an inset. Black bars represent the SD mesured by counting cell number daily by triplicate. (D) Doubling times of the HATcRPE1, TcRPE1HA and HATcRPE2 strains were estimated from four independent experiments. The bar graph represents the mean ± SEM of the doubling time.
Fig 7
Fig 7. Subcellular localization of the two RPE isoenzymes.
(A) Immunofluorescence assay of epimastigotes from HATcRPE1, TcRPE1HA, and HATcRPE2 CL Brener [pLEW13] lines after 72 h induction with tetracycline. From left to right: Parasites immunostained with rat anti-HA antibodies, nuclei and kinetoplasts (DAPI), merge image, and cell bodies visualized by interference contrast (DIC). The bar equals 5 μm. (B) Confocal images showing HATcRPE2, HATcRPE2SHLxAAA and PEPCK co-localization in CL Brener [pLEW13] lines after 72 h induction with tetracycline. From left to right: parasites immunostained with mouse anti-PEPCK polyclonal antibodies, parasites immunostained with rat anti-HA antibodies, cell bodies visualized by interference contrast (DIC), merge image, and line profiles of fluorescense relative intensity as a function of position for HATcRPE2 and HATcRPE2SHLxAAA (red line) and PEPCK (green line). The bar equals 5 μm. (C) Sucrose linear density gradient centrifugation of small granule fraction obtained from intact wild type epimastigotes of T.cruzi CL Brener clone. Plot of frequency (calculated as described in Materials and Methods) as a function of the fraction number ordered by increasing density. From left to right and from top to bottom, the activity of the following enzymes was assayed: TcRPE2; isocitrate dehydrogenase, a mitochondrial marker; hexokinase, a glycosomal marker, and acid phosphatase, a Golgi apparatus marker. Equilibrium densities of the fraction exhibiting maximal activity is indicated in each panel and expressed in g ml-1.

Similar articles

Cited by

References

    1. Barrett MP. The Pentose Phosphate Pathway and Parasitic Protozoa. Parasitol Today. 1997;13(I):11–6. - PubMed
    1. Wood T. Purification and properties of d-ribulose-5-phosphate 3-epimerase from calf liver. BBA—Enzymol. 1979;570(2):352–62. - PubMed
    1. Karmali A, Drake A, F, Spencer N. Purification, properties and assay of D-ribulose 5-phosphate 3-epimerase from human erythrocytes. Biochem J. 1983;211(3):617–23. - PMC - PubMed
    1. Nowitzki U, Wyrich R, Westhoff P, Henze K, Schnarrenberger C, Martin W. Cloning of the amphibolic Calvin cycle/OPPP enzyme d-ribulose-5-phosphate 3-epimerase (EC 5.1.3.1) from spinach chloroplasts: functional and evolutionary aspects. Plant Mol Biol. 1995;29(6):1279–91. - PubMed
    1. Bär J, Naumann M, Reuter R, Kopperschläger G. Improved purification of ribulose 5-phosphate 3-epimerase from Saccharomyces cerevisiae and characterization of the enzyme. Bioseparation. 1996;6(4):233–41. - PubMed

LinkOut - more resources