. 2017 Mar 14;17(6):1137-1148.
doi: 10.1039/c6lc01450j.

Paper-based microfluidic system for tear electrolyte analysis

Affiliations

Paper-based microfluidic system for tear electrolyte analysis

Ali K Yetisen et al. Lab Chip. .

Abstract

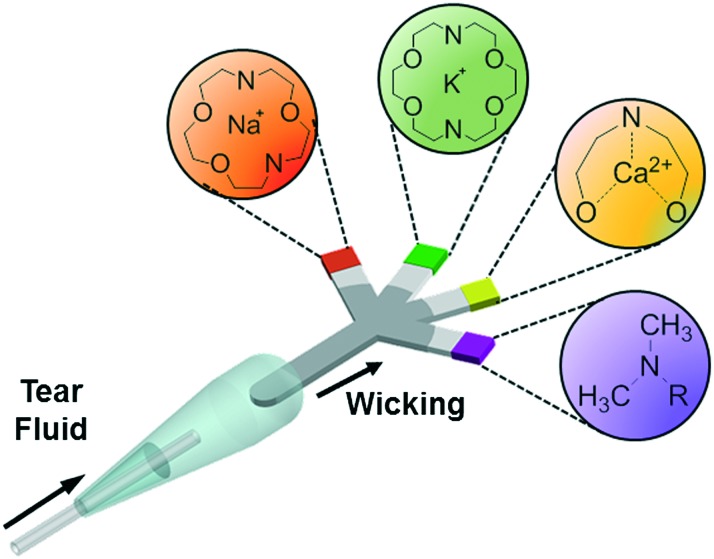
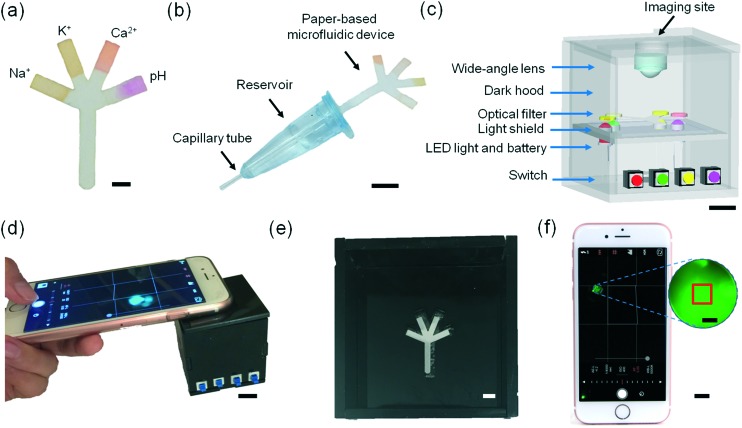
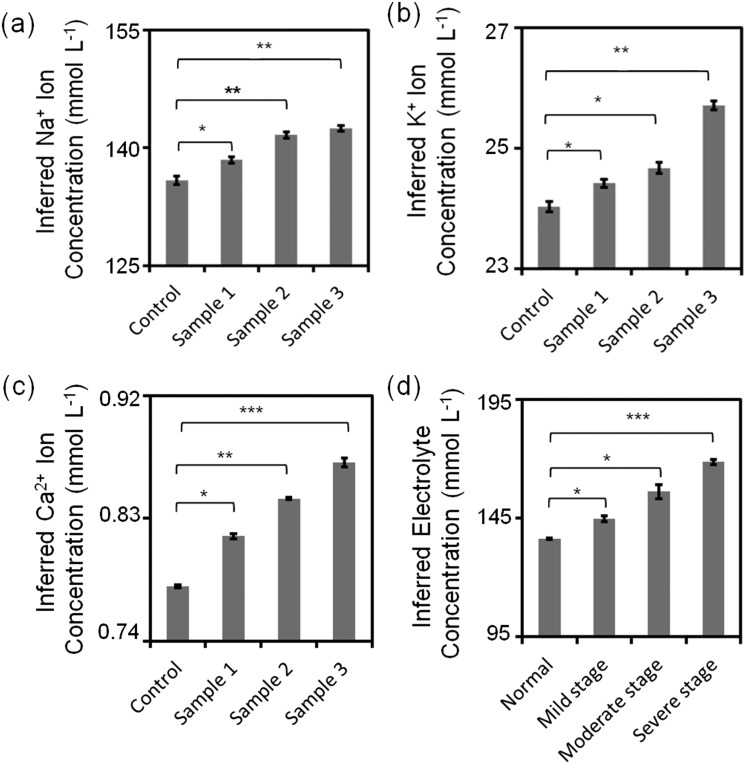
The analysis of tear constituents at point-of-care settings has a potential for early diagnosis of ocular disorders such as dry eye disease, low-cost screening, and surveillance of at-risk subjects. However, current minimally-invasive rapid tear analysis systems for point-of-care settings have been limited to assessment of osmolarity or inflammatory markers and cannot differentiate between dry eye subclassifications. Here, we demonstrate a portable microfluidic system that allows quantitative analysis of electrolytes in the tear fluid that is suited for point-of-care settings. The microfluidic system consists of a capillary tube for sample collection, a reservoir for sample dilution, and a paper-based microfluidic device for electrolyte analysis. The sensing regions are functionalized with fluorescent crown ethers, o-acetanisidide, and seminaphtorhodafluor that are sensitive to mono- and divalent electrolytes, and their fluorescence outputs are measured with a smartphone readout device. The measured sensitivity values of Na+, K+, Ca2+ ions and pH in artificial tear fluid were matched with the known ion concentrations within the physiological range. The microfluidic system was tested with samples having different ionic concentrations, demonstrating the feasibility for the detection of early-stage dry eye, differential diagnosis of dry eye sub-types, and their severity staging.


Figures

Fig. 1
Fig. 1. Principle of operation of the paper-based microfluidic system for the quantitative analysis of electrolytes in tear film.
Fig. 2
Fig. 2. Fluid dynamics characterization of G1 paper-based microfluidic devices at 24 °C. (a) Wicking distances of G1 strips as the width was varied from 2.0 to 5.0 mm. (b) The effect of increase in fluid viscosity from 1.0 to 10.0 mPa s on wicking distance in G1 strips (20 mm in length and 2 mm in width). Fluid viscosities were varied by changing the concentration of glucose (10 μL) from 0.5 to 3.0 mol L–1. (c) Wicking distances as the number of branches was increased from 1 to 4 within 60 s. Sample volume was 10 μL. (d) Photographs of paper-based microfluidic devices with different numbers of branches (1 to 4). Scale bar = 4 mm. (e) Bright-field microscopic image of G1 matrix. Scale bar = 50 μm. (f) Photographs of a four-channel paper-based microfluidic device, where Rhodamine B solution (10 mmol L–1) was used to show fluid diffusion as a function of time. Scale bar = 4 mm. Error bars represent standard error of the mean (n = 3).
Fig. 3
Fig. 3. Na+ and K+ ion measurements using fluorescent crown ether derivatives in buffer solutions (Tris, pH 7.4, 150 mmol L–1) at 24 °C. (a) Chelation mechanisms of fluorescent (i) diaza-15-crown-5 and (ii) diaza-18-crown-6 with monovalent metal ions. (b) Selectivities of diaza-15-crown-5 (λ ex/λ em: 485/528 nm) and diaza-18-crown-6 (λ ex/λ em: 360/460 nm) (25 μmol L–1) for mono/divalent ions (100 mmol L–1) in aqueous solutions (n = 3). (c) The effect of pH on fluorescence readouts at constant Na+ and K+ ions (100 mmol L–1), and diaza-15-crown-5 and diaza-18-crown-6 (25 μmol L–1) concentrations in aqueous solutions (n = 3). Quantifications of 16-fold diluted (d) Na+ and (e) K+ ions on G1 matrix at a constant probe concentration (25 μmol L–1) (n = 6). Insets show the quantifications of non-diluted Na+ and K+ ions on G1 matrix (n = 3). Shadows in Fig. 3c–e show the physiological pH, Na+ and K+ ion concentration range. Error bars represent standard error of the mean.
Fig. 4
Fig. 4. Quantification of divalent metal ions in buffer solution (Tris, pH 7.4, 150 mmol L–1) at 24 °C. (a) Chelation mechanism of o-acetanisidide with divalent metal ions. (b) Fluorescence readouts of o-acetanisidide (λ ex/λ em: 485/528 nm) in the presence mono/divalent metal ions in aqueous solutions (n = 3). (c) The effect of pH on fluorescence readouts of o-acetanisidide (25 μmol L–1) at constant Mg2+ and Ca2+ ion concentrations (100 mmol L–1) in aqueous solutions (n = 3). (d) Fluorescence intensity readouts of Mg2+ and Ca2+ ions (100 mmol L–1) as the concentration of o-acetanisidide were varied from 3–50 μmol L–1 (n = 3). (e) Quantification of 16-fold diluted Ca2+ ions on G1 matrix at a constant o-acetanisidide concentration (25 μmol L–1) (n = 6). Insets show the quantification of non-diluted Ca2+ ions on G1 matrix (n = 3). Shadows in Fig. 4c and e show the physiological pH and Ca2+ ion concentration range. Error bars represent standard error of the mean.
Fig. 5
Fig. 5. Quantification of pH values in buffer solutions (Tris, 150 mmol L–1) at 24 °C. (a) Principle of operation of seminaphtorhodafluor. (b) Fluorescence intensity readouts as the concentration of seminaphtorhodafluor (λ ex/λ em: 530/590 nm) was varied from 3–50 μmol L–1 at pH = 7.4 in aqueous solutions (n = 3). (c) Quantification of Tris buffer pH (inset) and 16-fold diluted Tris buffer (150 mmol L–1, pH = 7.4) on G1 matrix at a constant seminaphtorhodafluor concentration (25 μmol L–1) (n = 6). Insets show the quantification of non-diluted Tris buffer on G1 matrix (n = 3). Shadows in Fig. 5c show the physiological pH range. (d) Relative fluorescence intensity readouts of mono/divalent ions at a constant concentration of seminaphtorhodafluor (25 μmol L–1) at pH 7.4 (n = 3). Error bars represent standard error of the mean.
Fig. 6
Fig. 6. Microfluidic system for tear fluid analysis. (a) Paper-based microfluidic device impregnated with fluorescent probes. Scale bar = 2 mm. (b) Sample collection and dilution device using a capillary tube. Scale bar = 1 cm. (c) The schematic of the portable readout device. Scale bar = 1 cm. (d) The use of the portable readout device for capturing the image of the fluorescent probes. Scale bar = 1 cm. (e) Photograph of the interlayer groove to place the paper-based microfluidic device. Scale bar = 4 mm. (f) Screenshot of the smartphone app capturing an assay image. Scale bar = 1 cm. Red square (1 × 1 mm2) in the magnified screenshot (blue dashes) shows the selected sensing region. Scale bar = 1 mm.
Fig. 7
Fig. 7. Quantifications of electrolytes in artificial tear fluid using the smartphone readout system: (a) Na+ ions, (b) K+ ions, (c) Ca2+ ions and (d) H+ ions sensing. Scale bars = 2 mm. Insets in (a) and (b) show Na+ ion concentration in the range of 130–150 mmol L–1 and K+ ion concentration in the range of 24–26 mmol L–1. Error bars represent standard error of the mean (n = 6). Curves (red dashes) were fitted using eqn (3). Shadows show the physiological Na+, K+, Ca2+ ion concentration and pH ranges.
Fig. 8
Fig. 8. Quantitative analysis of simulated artificial tear samples. (a) Sub-type differentiation of dry eye: inferred (a) Na+, (b) K+, (c) Ca2+ ion concentrations and (d) different stages of dry eye. *: p < 0.05, **: p < 0.01, ***: p < 0.001, compared with control. Error bars represent standard error of the mean (n = 3).

References

    1. Pankratov D., González-Arribas E., Blum Z., Shleev S. Electroanalysis. 2016;28:1250–1266.
    1. Guzmán M., Keitelman I., Sabbione F., Trevani A. S., Giordano M., Galletti J. Clin. Exp. Immunol. 2016;184:248–256. - PMC - PubMed
    1. Cameron J. R., Tatham A. J. Acta Ophthalmol. 2016;94:533–539. - PubMed
    1. Craig J. P., Tomilnson A. Optom. Vis. Sci. 1997;74:8–13. - PubMed
    1. Holly F. Trans. Ophthalmol. Soc. U. K. 1984;104:374–380. - PubMed

Publication types