. 2017 Feb 7;89(3):1399-1404.
doi: 10.1021/acs.analchem.6b04337. Epub 2017 Jan 26.

Visualization, Quantification, and Alignment of Spectral Drift in Population Scale Untargeted Metabolomics Data

Affiliations

Visualization, Quantification, and Alignment of Spectral Drift in Population Scale Untargeted Metabolomics Data

Jeramie D Watrous et al. Anal Chem. .

Abstract

Untargeted liquid-chromatography-mass spectrometry (LC-MS)-based metabolomics analysis of human biospecimens has become among the most promising strategies for probing the underpinnings of human health and disease. Analysis of spectral data across population scale cohorts, however, is precluded by day-to-day nonlinear signal drifts in LC retention time or batch effects that complicate comparison of thousands of untargeted peaks. To date, there exists no efficient means of visualization and quantitative assessment of signal drift, correction of drift when present, and automated filtering of unstable spectral features, particularly across thousands of data files in population scale experiments. Herein, we report the development of a set of R-based scripts that allow for pre- and postprocessing of raw LC-MS data. These methods can be integrated with existing data analysis workflows by providing initial preprocessing bulk nonlinear retention time correction at the raw data level. Further, this approach provides postprocessing visualization and quantification of peak alignment accuracy, as well as peak-reliability-based parsing of processed data through hierarchical clustering of signal profiles. In a metabolomics data set derived from ∼3000 human plasma samples, we find that application of our alignment tools resulted in substantial improvement in peak alignment accuracy, automated data filtering, and ultimately statistical power for detection of metabolite correlates of clinical measures. These tools will enable metabolomics studies of population scale cohorts.


Conflict of interest statement

The authors declare no competing financial interest.

This set of annotated R-based scripts is available for the metabolomics community at http://www.jainlaboratory.org/tools/alignmentscripts.html, along with user documentation and details.

Figures

Figure 1
Figure 1
Misalignment of spectral data. (A) Typical LC-MS data analysis workflow. Steps encompassed in the red box indicated steps where drift correction was applied. (B) Possible outcomes of improper alignment. Left column shows proper alignment of the two peaks within the retention time window (dashed lines), whereas misaligned (center) and cross-aligned (right) peaks are shown along with their impact on final data outcomes.
Figure 2
Figure 2
Quantification of signal drift. (A) Modeling nonlinear retention time drift across four representative sample preparation batches (N ~ 90 samples per batch). The blue line indicates mean retention drift relative to a reference sample whereas the clusters of black points indicate individual retention times for the 24 internal standards and 60 landmark peaks. Drift models were generated for each of the 2895 samples and used to create corrected .mzXML files. (B) Quantifying peak alignment quality by plotting the percent of misaligned features based on batch-to-batch consistency within randomized patient samples and calculating the area under the curve (AUC) with a higher AUC value indicating better alignment. (C) Example overlay of EIC’s from each of the 33 batches for m/z 269.1782, which displays many isobaric structures, before and after retention time correction.
Figure 3
Figure 3
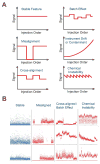
Hierarchical clustering-based filtering of unreliable signals. (A) Examples of possible intensity patterns that can occur during a large scale LC-MS experiment. Red line indicates mean intensity value for a chromatographic feature across all batches. (B) Examples of parsed clustering output showing stable features (consistent means across all batches), misaligned features (signal loss across one or more batches), cross-aligned and batch affected features (regular or erratic shifting of mean signal between batches), and chemically unstable features (gradual increase or decrease in signal over each batch or across the entire experiment).

Similar articles

Cited by

References

    1. Johnson CH, Ivanisevic J, Siuzdak G. Nat Rev Mol Cell Biol. 2016;17:451–459. - PMC - PubMed
    1. Nicholson JK, Holmes E, Kinross JM, Darzi AW, Takats Z, Lindon JC. Nature. 2012;491:384–392. - PubMed
    1. Nagana Gowda GA, Raftery D. Curr Metabolomics. 2013;1:227–240. - PMC - PubMed
    1. Cheng S, Larson MG, McCabe EL, Murabito JM, Rhee EP, Ho JE, Jacques PF, Ghorbani A, Magnusson M, Souza AL, Deik AA, Pierce KA, Bullock K, O’Donnell CJ, Melander O, Clish CB, Vasan RS, Gerszten RE, Wang TJ. Nat Commun. 2015;6:6791–6799. - PMC - PubMed
    1. Wang TJ, Larson MG, Vasan RS, Cheng S, Rhee EP, McCabe E, Lewis GD, Fox CS, Jacques PF, Fernandez C, O’Donnell CJ, Carr SA, Mootha VK, Florez JC, Souza A, Melander O, Clish CB, Gerszten RE. Nat Med. 2011;17:448–453. - PMC - PubMed

Publication types

LinkOut - more resources