

Increased oxidative stress alters nucleosides metabolite levels in sickle cell anemia
- PMID: 28209096
- PMCID: PMC6837566
- DOI: 10.1080/13510002.2017.1288973
Increased oxidative stress alters nucleosides metabolite levels in sickle cell anemia
Abstract
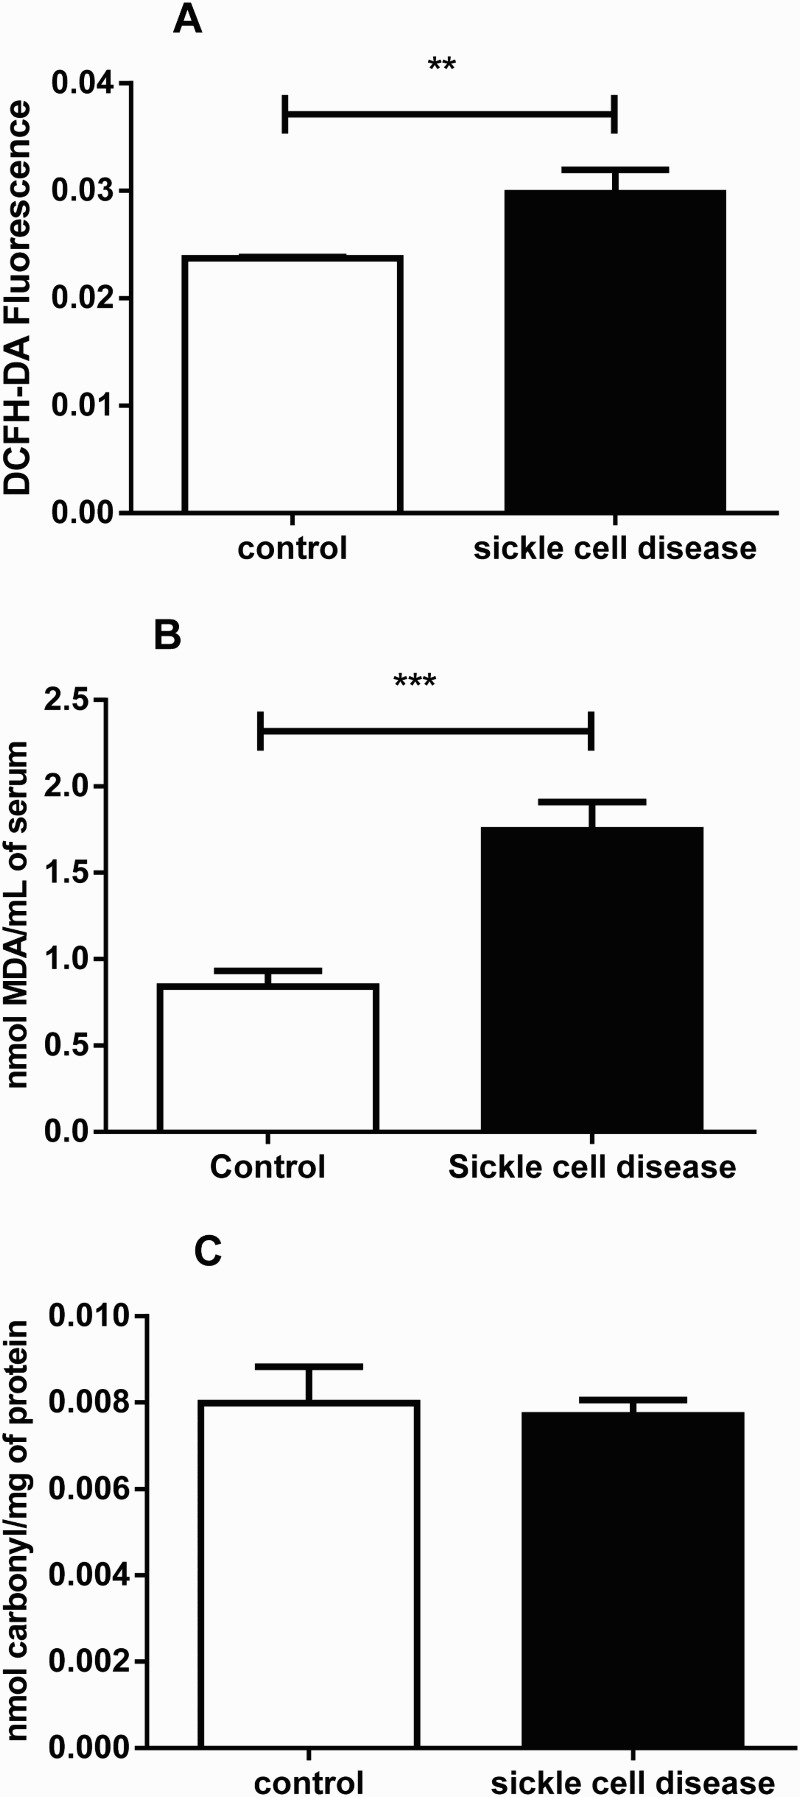
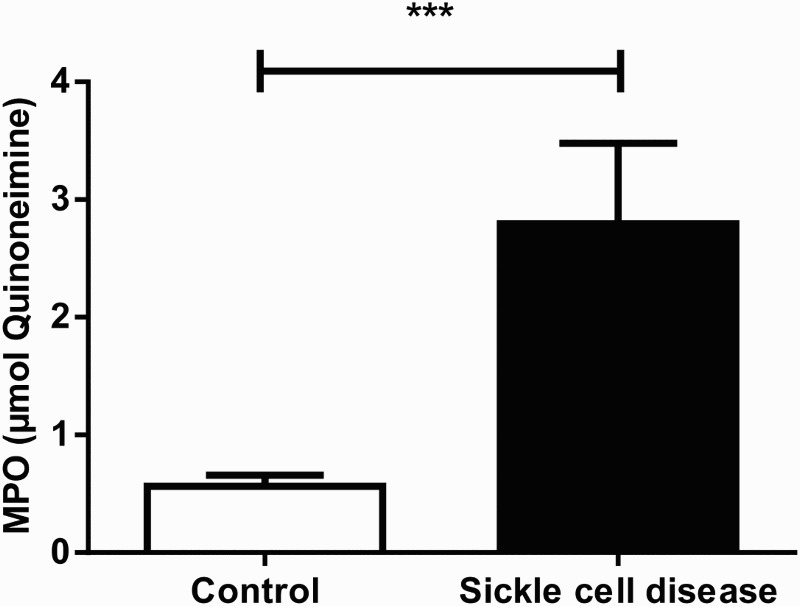
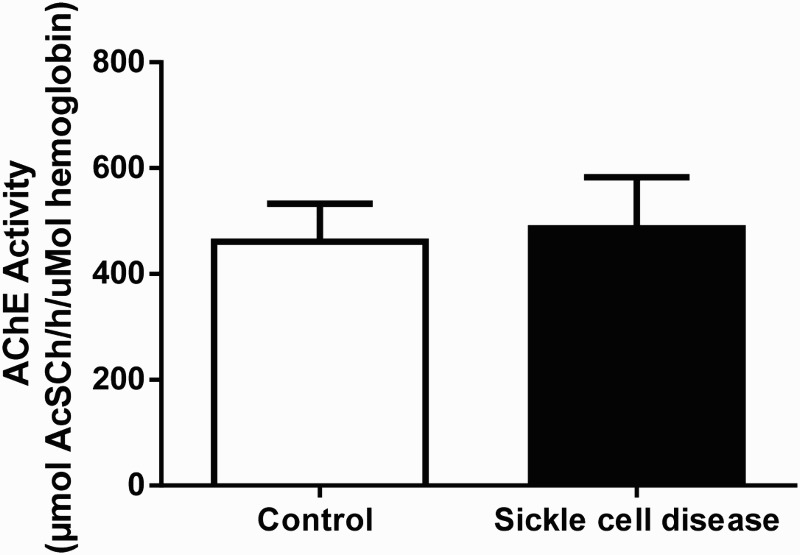
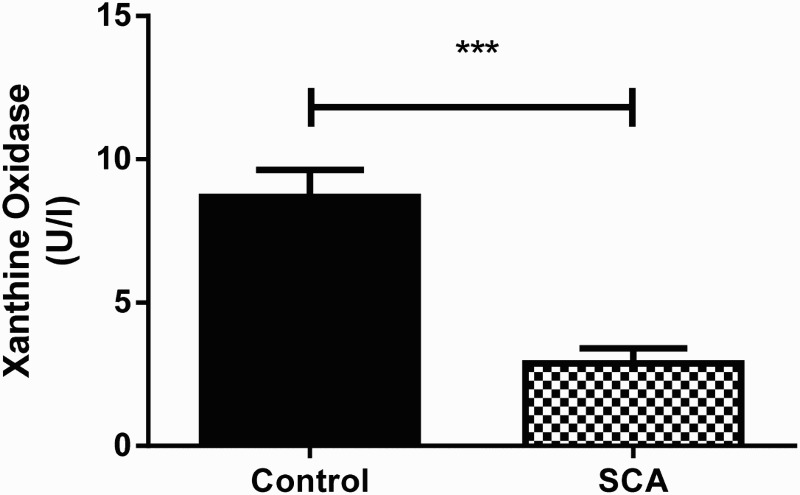
Objectives: This study was conducted to assess the markers of oxidative stress, myeloperoxidase (MPO), acetylcholinesterase (AChE) and xanthine oxidase (XO) activities as well as the levels of nucleotide metabolites in sickle cell anemia (SCA) patients.
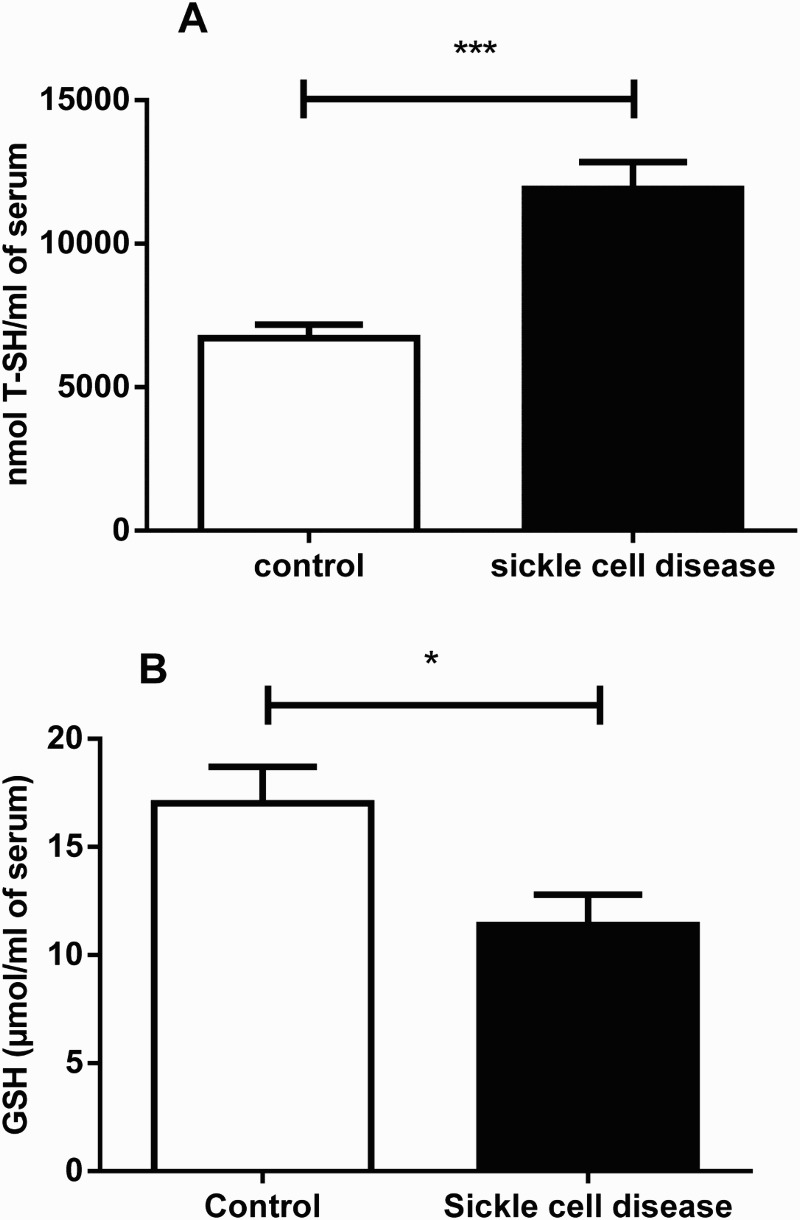
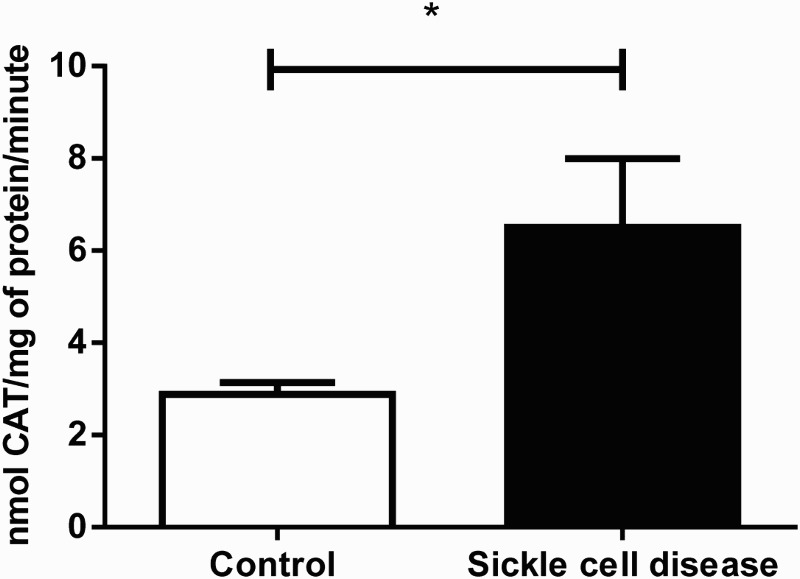
Methods: Fifteen SCA treated patients and 30 health subjects (control group) were selected. The markers of oxidative stress (levels of reactive oxygen species (ROS), plasma proteins, carbonyl content, lipid peroxidation (TBARS), total thiols (T-SH), glutathione and catalase activity), MPO, AChE and XO activities as well as the levels of nucleotide metabolites were measured in SCA patients.
Results: ROS, thiobarbituric acid-reactive substances (TBARS) and T-SH levels as well as the activities of catalase and MPO were significantly increased while glutathione level was reduced in SCA patients. Furthermore, a significant (P < 0.001) increase in hypoxanthine level was demonstrated in SCA patients. However, the serum levels for xanthine (P < 0.01) and uric acid (P < 0.001) were decreased in SCA patients. A significant (P < 0.001) decrease in XO activity was detected in SCA patients.
Discussion: The altered parameters in SCA patients suggest that the generation and impairment of oxidative stress in this disease as well as antioxidant markers are contributory factors towards cellular redox homeostasis and alteration of purine metabolites.
Keywords: Sickle cell anemia; enzymes; hypoxanthine; lipid peroxidation; oxidative stress; reactive oxygen species; uric acid; xanthine.
Figures

Similar articles
-
Protective effect of coadministered superoxide dismutase and catalase against stress-induced gastric mucosal lesions.Clin Exp Pharmacol Physiol. 2003 Aug;30(8):545-50. doi: 10.1046/j.1440-1681.2003.03871.x. Clin Exp Pharmacol Physiol. 2003. PMID: 12890175
-
Antioxidant intervention attenuates oxidative stress in children and teenagers with Down syndrome.Res Dev Disabil. 2014 Jun;35(6):1228-36. doi: 10.1016/j.ridd.2014.03.013. Epub 2014 Mar 28. Res Dev Disabil. 2014. PMID: 24685938
-
Consumption of green tea favorably affects oxidative stress markers in weight-trained men.Nutrition. 2008 May;24(5):433-42. doi: 10.1016/j.nut.2008.01.009. Epub 2008 Mar 12. Nutrition. 2008. PMID: 18337059 Clinical Trial.
-
Decoding the role of SOD2 in sickle cell disease.Blood Adv. 2019 Sep 10;3(17):2679-2687. doi: 10.1182/bloodadvances.2019000527. Blood Adv. 2019. PMID: 31506286 Free PMC article. Review.
-
Interaction of antioxidants and their implication in genetic anemia.Proc Soc Exp Biol Med. 1999 Dec;222(3):274-82. doi: 10.1177/153537029922200310. Proc Soc Exp Biol Med. 1999. PMID: 10601886 Review.
Cited by
-
From Stress to Sick(le) and Back Again-Oxidative/Antioxidant Mechanisms, Genetic Modulation, and Cerebrovascular Disease in Children with Sickle Cell Anemia.Antioxidants (Basel). 2023 Nov 7;12(11):1977. doi: 10.3390/antiox12111977. Antioxidants (Basel). 2023. PMID: 38001830 Free PMC article. Review.
-
Association between composite dietary antioxidant indices and anemia: NHANES 2003-2018.PLoS One. 2025 Jan 2;20(1):e0316397. doi: 10.1371/journal.pone.0316397. eCollection 2025. PLoS One. 2025. PMID: 39746109 Free PMC article.
-
Redox Signaling in Sickle Cell Disease.Curr Opin Physiol. 2019 Jun;9:26-33. doi: 10.1016/j.cophys.2019.04.022. Epub 2019 May 2. Curr Opin Physiol. 2019. PMID: 31240269 Free PMC article.
-
Neutrophil extracellular trap regulators in sickle cell disease: Modulation of gene expression of PADI4, neutrophil elastase, and myeloperoxidase during vaso-occlusive crisis.Res Pract Thromb Haemost. 2020 Dec 16;5(1):204-210. doi: 10.1002/rth2.12463. eCollection 2021 Jan. Res Pract Thromb Haemost. 2020. PMID: 33537545 Free PMC article.
-
Influence of Oxidative Stress Biomarkers and Genetic Polymorphisms on the Clinical Severity of Hydroxyurea-Free Senegalese Children with Sickle Cell Anemia.Antioxidants (Basel). 2020 Sep 14;9(9):863. doi: 10.3390/antiox9090863. Antioxidants (Basel). 2020. PMID: 32937882 Free PMC article.
References
-
- Stuart MJ, Nagel RL. Sickle-cell disease. The Lancet 2004;364:1343–1360. Available from: http://www.sciencedirect.com/science/article/pii/S0140673604171924. doi: 10.1016/S0140-6736(04)17192-4 - DOI - PubMed
-
- Belcher JD, Beckman JD, Balla G, et al. . Heme degradation and vascular injury. Antioxid Redox Signal. 2010;12:233–248. Available from: http://www.pubmedcentral.nih.gov/articlerender.fcgi?artid = 2821146&tool.... doi: 10.1089/ars.2009.2822 - DOI - PMC - PubMed
MeSH terms
Substances
LinkOut - more resources
Full Text Sources
Other Literature Sources
Medical
Research Materials
Miscellaneous