

Integrated strategy for in vitro characterization of a bileaflet mechanical aortic valve
- PMID: 28209171
- PMCID: PMC5314609
- DOI: 10.1186/s12938-017-0314-2
Integrated strategy for in vitro characterization of a bileaflet mechanical aortic valve
Abstract
Background: Haemodynamic performance of heart valve prosthesis can be defined as its ability to fully open and completely close during the cardiac cycle, neither overloading heart work nor damaging blood particles when passing through the valve. In this perspective, global and local flow parameters, valve dynamics and blood damage safety of the prosthesis, as well as their mutual interactions, have all to be accounted for when assessing the device functionality. Even though all these issues have been and continue to be widely investigated, they are not usually studied through an integrated approach yet, i.e. by analyzing them simultaneously and highlighting their connections.
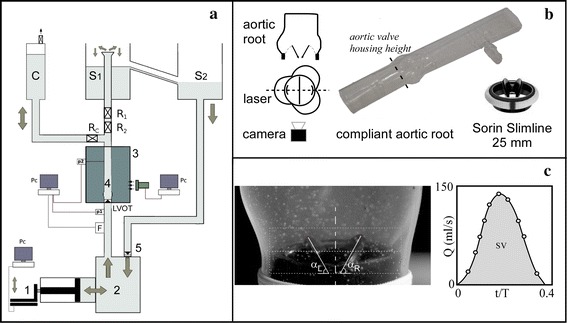
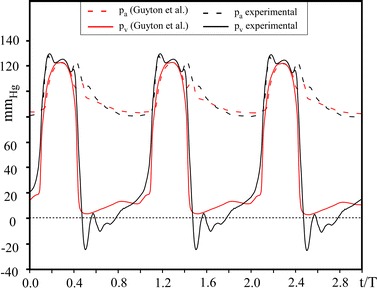
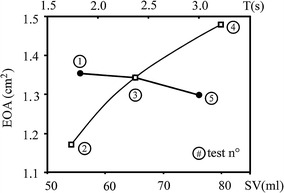
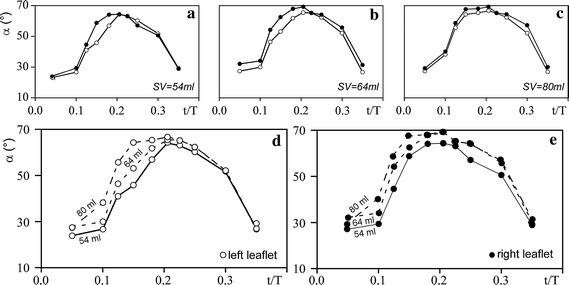
Results: An in vitro test campaign of flow through a bileaflet mechanical heart valve (Sorin Slimline 25 mm) was performed in a suitably arranged pulsatile mock loop able to reproduce human systemic pressure and flow curves. The valve was placed in an elastic, transparent, and anatomically accurate model of healthy aorta, and tested under several pulsatile flow conditions. Global and local hydrodynamics measurements and leaflet dynamics were analysed focusing on correlations between flow characteristics and valve motion. The haemolysis index due to the valve was estimated according to a literature power law model and related to hydrodynamic conditions, and a correlation between the spatial distribution of experimental shear stress and pannus/thrombotic deposits on mechanical valves was suggested. As main and general result, this study validates the potential of the integrated strategy for performance assessment of any prosthetic valve thanks to its capability of highlighting the complex interaction between the different physical mechanisms that govern transvalvular haemodynamics.
Conclusions: We have defined an in vitro procedure for a comprehensive analysis of aortic valve prosthesis performance; the rationale for this study was the belief that a proper and overall characterization of the device should be based on the simultaneous measurement of all different quantities of interest for haemodynamic performance and the analysis of their mutual interactions.
Keywords: Haemolysis index; Image velocimetry; Pulse duplicator; Valve leaflets dynamics.
Figures
Similar articles
-
Evaluation technique for bileaflet mechanical valves.J Heart Valve Dis. 2002 Mar;11(2):275-82. J Heart Valve Dis. 2002. PMID: 12000172
-
An integrated macro/micro approach to evaluating pivot flow within the Medtronic ADVANTAGE bileaflet mechanical heart valve.J Heart Valve Dis. 2003 Jul;12(4):503-12. J Heart Valve Dis. 2003. PMID: 12918854
-
In vitro comparison of bileaflet aortic heart valve prostheses. St. Jude Medical, CarboMedics, modified Edwards-Duromedics, and Sorin-Bicarbon valves.J Thorac Cardiovasc Surg. 1993 Sep;106(3):412-20. J Thorac Cardiovasc Surg. 1993. PMID: 8361181
-
Experimental Assessment of Flow Fields Associated with Heart Valve Prostheses Using Particle Image Velocimetry (PIV): Recommendations for Best Practices.Cardiovasc Eng Technol. 2018 Sep;9(3):273-287. doi: 10.1007/s13239-018-0348-z. Epub 2018 Mar 12. Cardiovasc Eng Technol. 2018. PMID: 29532332 Review.
-
Review of numerical methods for simulation of mechanical heart valves and the potential for blood clotting.Med Biol Eng Comput. 2017 Sep;55(9):1519-1548. doi: 10.1007/s11517-017-1688-9. Epub 2017 Jul 26. Med Biol Eng Comput. 2017. PMID: 28744828 Review.
Cited by
-
Hemodynamic Performance of Dysfunctional Prosthetic Heart Valve with the Concomitant Presence of Subaortic Stenosis: In Silico Study.Bioengineering (Basel). 2020 Aug 7;7(3):90. doi: 10.3390/bioengineering7030090. Bioengineering (Basel). 2020. PMID: 32784661 Free PMC article.
-
Causes and treatment strategies of unilateral leaflet escape of bileaflet mechanical prosthetic heart valves after surgery: a case series.BMC Cardiovasc Disord. 2023 Feb 7;23(1):73. doi: 10.1186/s12872-023-03106-0. BMC Cardiovasc Disord. 2023. PMID: 36750948 Free PMC article.
-
Distensibility of Deformable Aortic Replicas Assessed by an Integrated In-Vitro and In-Silico Approach.Bioengineering (Basel). 2022 Feb 26;9(3):94. doi: 10.3390/bioengineering9030094. Bioengineering (Basel). 2022. PMID: 35324783 Free PMC article.
References
-
- Roger VL, Go AS, Lloyd-Jones DM, Adams RJ, Berry JD, Brown TM, Carnethon MR, Dai S, De Simone G, Ford ES, Fox CS, Fullerton HJ, Gillespie C, Greenlund KJ, Hailpern SM, Heit JA, Ho PM, Howard VJ, Kissela BM, Kittner SJ, Lackland DT, Lichtman JH, Lisabeth LD, Makuc DM, Marcus GM, Marelli A, Matchar DB, McDermott MM, Meigs JB, Moy CS, Mozaffarian D, Mussolino ME, Nichol G, Paynter NP, Rosamond WD, Sorlie PD, Stafford RS, Turan TN, Turner MB, Wong ND, Wylie-Rosett J. Heart disease and stroke statistics—2011 update: a report from the American Heart Association. Circulation. 2011;123(4):18–209. doi: 10.1161/CIR.0b013e3182009701. - DOI - PMC - PubMed
-
- Faludi R, Szulik M, D’hooge J, Herijgers P, Rademakers F, Pedrizzetti G, Voigt JU. Left ventricular flow patterns in healthy subjects and patients with prosthetic mitral valves: an in vivo study using echocardiographic particle image velocimetry. J Thorac Cardiovasc Surg. 2010;139:1501–1510. doi: 10.1016/j.jtcvs.2009.07.060. - DOI - PubMed
-
- von Knobelsdorff-Brenkenhoffa F, Trauzeddela R, Barkerb A, Gruettnera H, Marklb M, Schulz-Mengera J. Blood flow characteristics in the ascending aorta after aortic valve replacement—a pilot study using 4D-flow MRI. Int J Cardiol. 2010;170:426–433. doi: 10.1016/j.ijcard.2013.11.034. - DOI - PMC - PubMed
MeSH terms
LinkOut - more resources
Full Text Sources
Other Literature Sources
Research Materials
