. 2017 May;23(5):735-748.
doi: 10.1261/rna.060541.116. Epub 2017 Feb 16.

High-resolution profiling of NMD targets in yeast reveals translational fidelity as a basis for substrate selection

Affiliations

High-resolution profiling of NMD targets in yeast reveals translational fidelity as a basis for substrate selection

Alper Celik et al. RNA. 2017 May.

Abstract

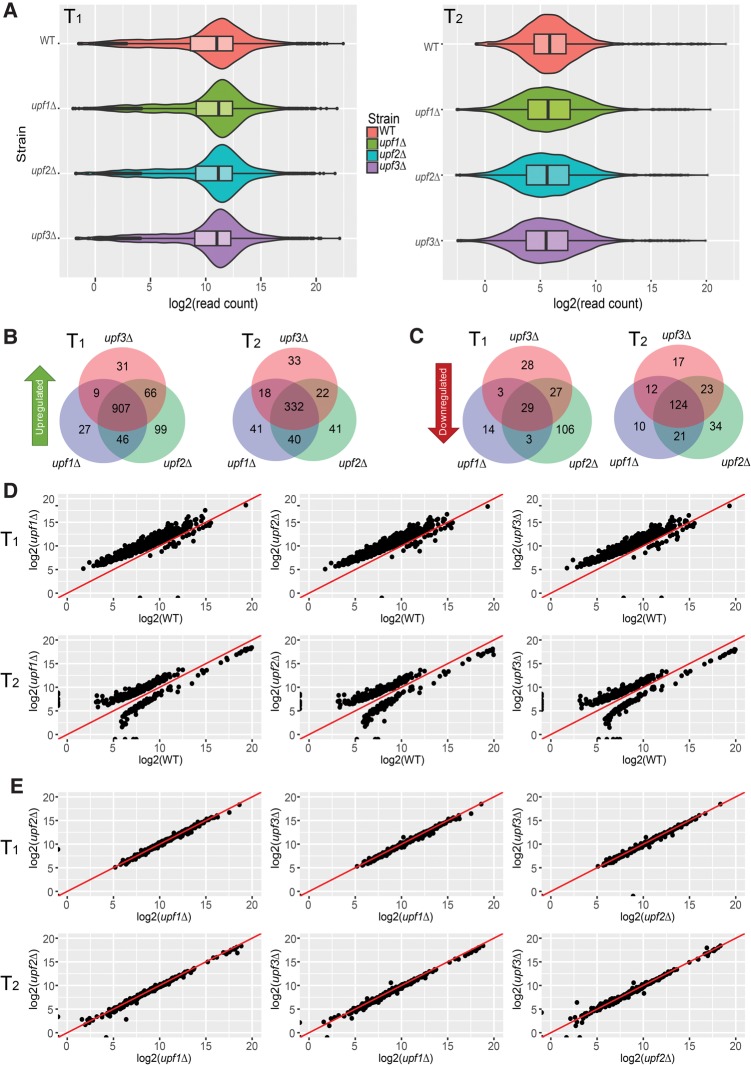
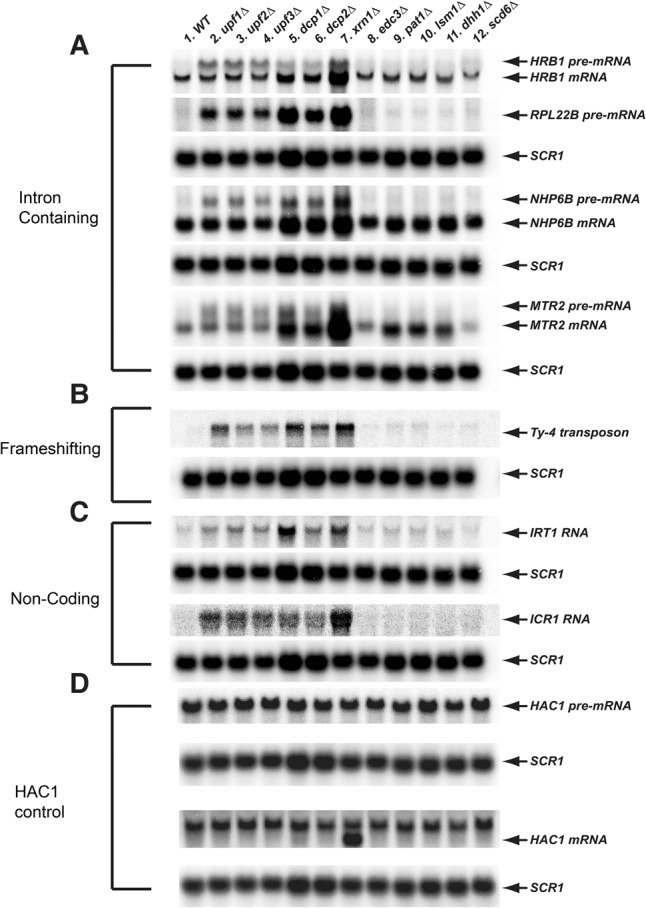
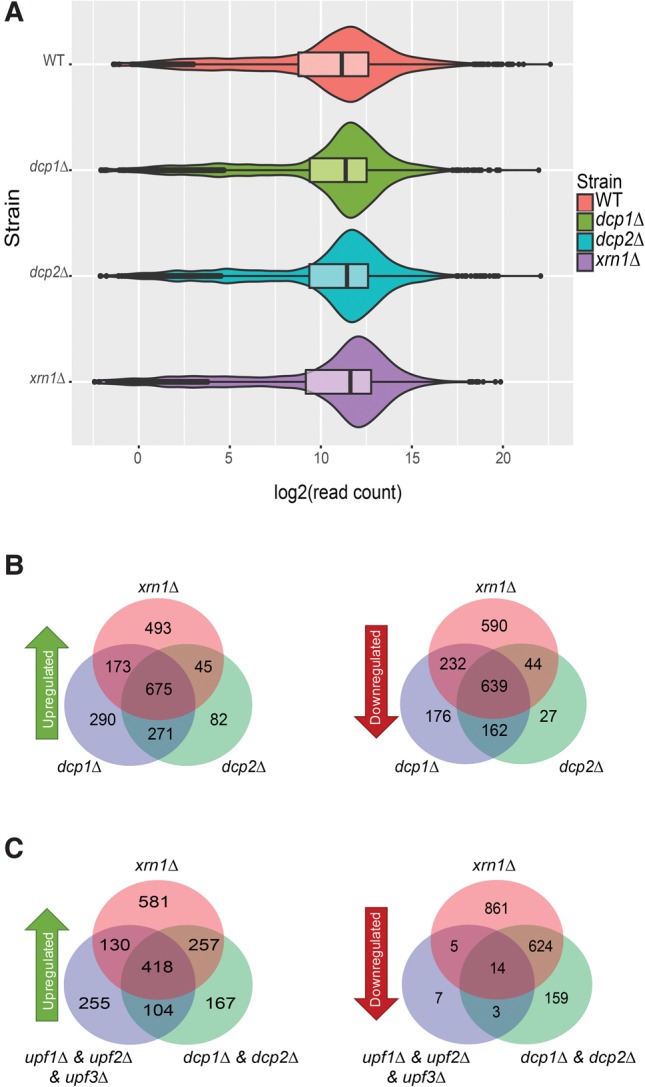
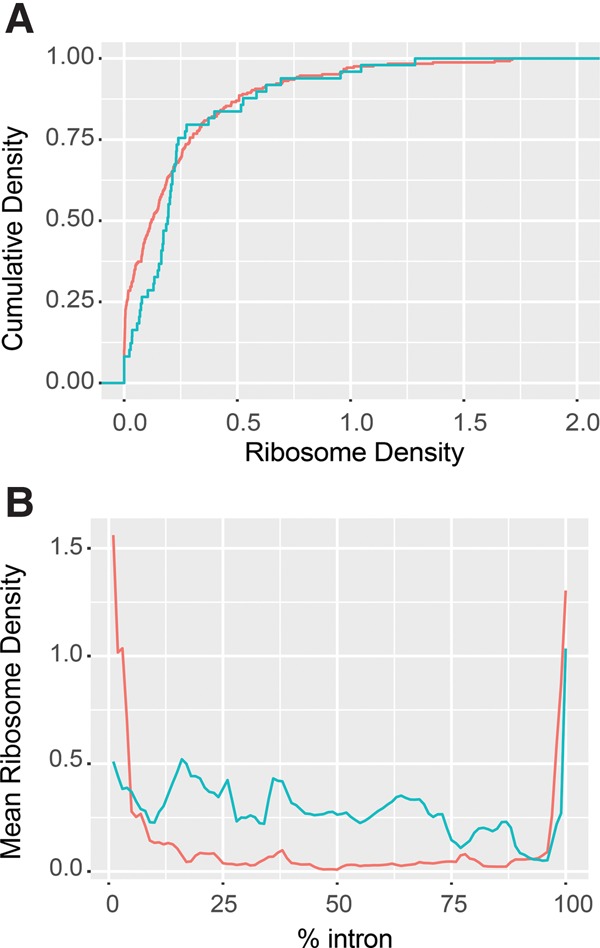
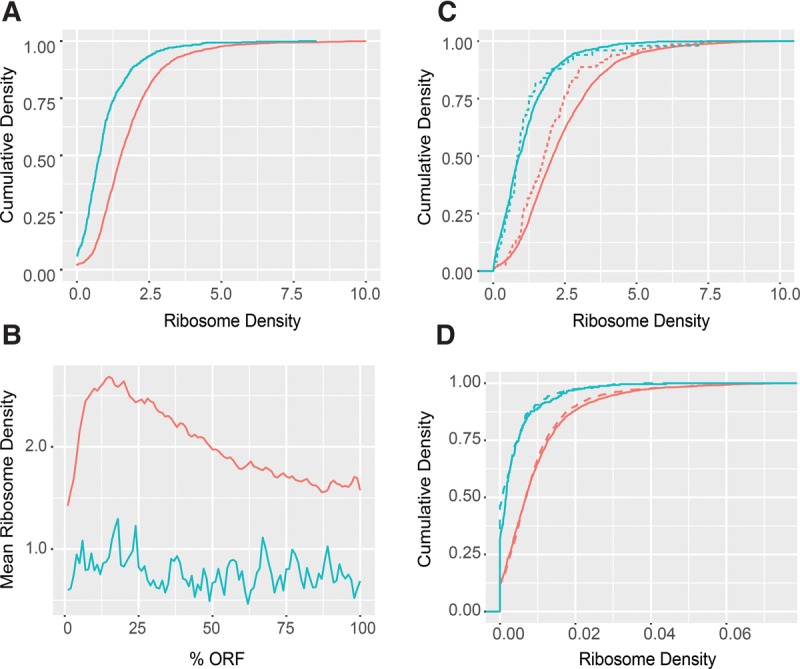
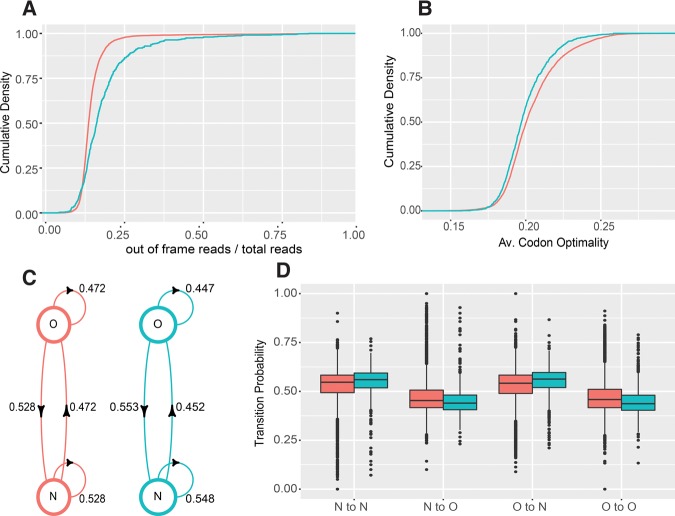
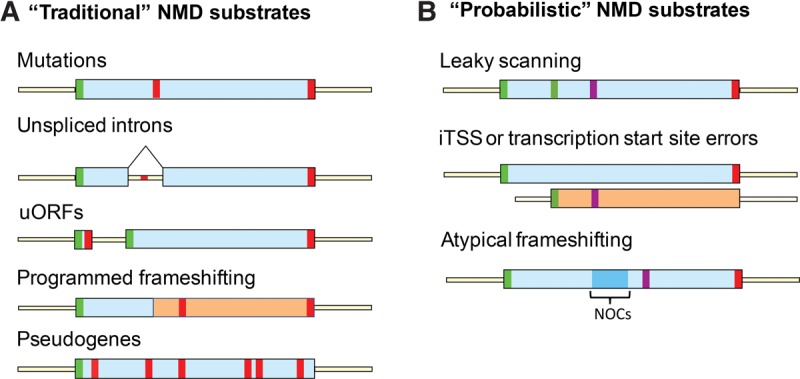
Nonsense-mediated mRNA decay (NMD) plays an important role in eukaryotic gene expression, yet the scope and the defining features of NMD-targeted transcripts remain elusive. To address these issues, we reevaluated the genome-wide expression of annotated transcripts in yeast cells harboring deletions of the UPF1, UPF2, or UPF3 genes. Our new RNA-seq analyses confirm previous results of microarray studies, but also uncover hundreds of new NMD-regulated transcripts that had escaped previous detection, including many intron-containing pre-mRNAs and several noncoding RNAs. The vast majority of NMD-regulated transcripts are normal-looking protein-coding mRNAs. Our bioinformatics analyses reveal that this set of NMD-regulated transcripts generally have lower translational efficiency and higher ratios of out-of-frame translation. NMD-regulated transcripts also have lower average codon optimality scores and higher transition probability to nonoptimal codons. Collectively, our results generate a comprehensive catalog of yeast NMD substrates and yield new insights into the mechanisms by which these transcripts are targeted by NMD.

Keywords: NMD substrates; codon optimality; translational fidelity and efficiency.


Figures

FIGURE 1.
FIGURE 1.
Upf1, Upf2, and Upf3 regulate the same set of transcripts in yeast. (A) RNA-seq libraries from WT, upf1Δ, upf2Δ, and upf3Δ strains display comparable overall read count distributions for both transcriptome 1 (T1; left panel) and transcriptome 2 (T2; right panel). Violin and box-plots were used to visualize the average sequence reads distribution of the transcriptomes of the indicated strains from three independent experiments. (B,C) Transcripts up- and down-regulated in upf1Δ, upf2Δ, and upf3Δ strains show significant overlap. Transcripts up- or down-regulated in each UPF deletion strain were identified by comparisons to the WT strain. Venn diagrams were used to display the relationships among the sets of transcripts that are up-regulated (B) and down-regulated (C) in T1 or T2 of upf1Δ, upf2Δ, and upf3Δ strains. (D) All three UPF deletion strains display similar genome-wide expression patterns. Scatterplots were used to compare the read count values of differentially expressed transcripts between WT and upf1Δ, upf2Δ, or upf3Δ strains. The vast majority of differentially expressed transcripts in UPF deletion strains showed up-regulation and a small number of transcripts showed down-regulation. The y = x line is shown in red. (Top panel) Pairwise comparisons of the expression levels between WT and each UPF deletion strain for 936 differentially expressed transcripts from transcriptome 1. (Bottom panel) Pairwise comparisons of the expression levels between WT and each UPF deletion strain for 456 differentially expressed transcripts from transcriptome 2. (E) Transcripts commonly regulated by NMD each have virtually identical expression values in upf1Δ, upf2Δ, or upf3Δ strains. As in D, scatterplots were used to compare the read count values of NMD-regulated transcripts between upf1Δ and upf2Δ, upf1Δ and upf3Δ, and upf2Δ or upf3Δ strains. (Top panel) Differentially expressed transcripts from transcriptome 1. (Bottom panel) Differentially expressed transcripts from transcriptome 2.
FIGURE 2.
FIGURE 2.
Validation of several different classes of NMD substrates by Northern blotting. Northern blotting analyses of (A) intron-containing transcripts (HRB1, RPL22B, NHP6B, and MTR2), (B) transcripts using frameshifting during translation (Ty-4 transposons), (C) “noncoding” RNAs (ICR1 and IRT1), and (D) negative control transcripts (HAC1 pre-mRNA). Total RNA was isolated from the indicated strains, and the steady-state levels of individual transcripts in these strains were analyzed by Northern blotting. In each case, a random-primed probe was hybridized to the blot and SCR1 served as the loading control.
FIGURE 3.
FIGURE 3.
NMD substrates are principally degraded by decapping and 5′–3′ exonucleolytic decay. (A) RNA-seq libraries from WT, dcp1Δ, dcp2Δ, and xrn1Δ strains display normal and comparable overall read count distributions. As in Figure 1A, violin and box-plots were used to visualize the average sequence reads distribution of the transcriptomes of the indicated strains from three independent experiments. (B) Transcripts up- or down-regulated in dcp1Δ, dcp2Δ, and xrn1Δ strains show significant overlap. Transcripts up- or down-regulated in dcp1Δ, dcp2Δ, and xrn1Δ strains were identified by comparisons to the WT strain. (C) Transcripts commonly up- or down-regulated from transcriptome 1 in all three UPF deletion strains show significant overlap with transcripts up-regulated in both dcp1Δ and dcp2Δ strains or an xrn1Δ strain. Venn diagrams were used to display the relationships among the up- or down-regulated transcripts from the indicated strains.
FIGURE 4.
FIGURE 4.
NMD targeted intron-containing pre-mRNAs are engaged in translation. (A) Cumulative density plot of ribosome density of the intronic regions for pre-mRNAs targeted (blue, n = 57) or not targeted (red, n = 244) by NMD. This plot illustrates the fraction (on the y-axis) of transcripts having the indicated ribosome densities (on the x-axis). (B) Distribution of mean ribosome densities over normalized intronic regions for the same two sets of intron-containing transcripts as in A. Plots in A and B were derived from the ribosome profiling data of WT cells by Young et al. (2015). Ribosome densities were calculated as profilingcoverage/RNA-seqcoverage for each intron. Introns of NMD-targeted pre-mRNAs show higher ribosome densities than introns of the pre-mRNAs that are not targeted by NMD (two-sample KS test P = 0.038).
FIGURE 5.
FIGURE 5.
NMD substrates are less efficiently translated than nonsubstrates independent of the NMD machinery. (A) Cumulative density plots of ribosome densities derived from ribosome profiling data of WT cells for normal-looking NMD substrates (blue n = 746) and non-NMD substrates (red = 4633). (B) Mean ribosome densities over normalized ORFs derived from the same data and for the same two sets of transcripts shown in A. (C) Cumulative density plots of ribosome densities derived from the same data in A for uORF-containing transcripts targeted (dashed, blue n = 42) or not targeted (dashed, red n = 199) by NMD and for uORF-lacking transcripts targeted (solid, blue n = 704) or not targeted (solid, red n = 4434) by NMD. (D) Cumulative density plots of ribosome densities derived from other ribosome profiling data sets of WT (solid) and upf1Δ (dashed) cells for normal-looking NMD substrates (blue) and non-NMD substrates (red) shown in A. Plots in A, B, and C were derived from the ribosome profiling data of Young et al. (2015), and plots in D were derived from the ribosome profiling data of Smith et al. (2014). Ribosome densities were calculated as profilingcoverage/RNA-seqcoverage for each transcript. Two-sample KS test P-values are described in the Results section.
FIGURE 6.
FIGURE 6.
NMD substrates have lower translation fidelity and lower codon optimality. (A) Cumulative density plots of in-frame read ratios over total reads derived from ribosome profiling data of WT cells for intron-lacking NMD substrates (n = 746, blue) and non-NMD substrates (n = 4633, red). (B) Cumulative density plots of mean codon optimality scores for two sets of transcripts shown in A. (C) Mean transition probabilities of a two-state discrete time Markov chain between optimal (O) and nonoptimal (N) codons for intron-lacking NMD substrates (blue) and non-NMD substrates (red). (D) Distributions of Markov chain codon transition probabilities for intron-lacking NMD substrates (blue) and non-NMD substrates (red). Plots in A were derived from the ribosome profiling data of Young et al. (2015), and plots in B, C, and D were based on codon optimality assignments and scores published by Pechmann and Frydman (2013). Two-sample KS test P-values are described in the Results section.
FIGURE 7.
FIGURE 7.
Different classes of NMD substrates. (A) “Traditional” NMD substrates. Translation of these NMD substrates commences at initiation codons located at ORF (or uORF) 5′ ends, proceeds 3′, and leads to an in-frame encounter with a coding region premature termination codon. Transcripts in this class include mRNAs derived from nonsense alleles, pre-mRNAs that enter the cytoplasm with unspliced introns, uORF-containing mRNAs, mRNAs in which programmed frameshifting allows a fraction of ribosomes to avoid premature termination, and mRNAs transcribed from pseudogenes. (B) “Probabilistic” NMD substrates. These NMD substrates lack in-frame premature termination codons in their coding regions, but contain mRNA features that promote either downstream out-of-frame translational initiation or frameshifting and thus trigger premature termination in a new reading frame. Transcripts in this category include mRNAs with poor sequence context around the normal initiation codon, mRNAs whose transcription start site is internal to the principal ORF, and mRNAs with lower overall codon optimality or a long stretch of nonoptimal codons (NOCs). In each of these cases, a subset of ribosomes translates the mRNA in a frame different from that of the annotated ORF. (Green) Initiation codon, (red) stop codon, (yellow) UTR, (purple) stop codon encountered in the +1 or +2 reading frame; (blue) cluster of nonoptimal codons.

References

    1. Anders S, Huber W. 2010. Differential expression analysis for sequence count data. Genome Biol 11: R106. - PMC - PubMed
    1. Arribere JA, Gilbert WV. 2013. Roles for transcript leaders in translation and mRNA decay revealed by transcript leader sequencing. Genome Res 23: 977–987. - PMC - PubMed
    1. Avery P, Vicente-Crespo M, Francis D, Nashchekina O, Alonso CR, Palacios IM. 2011. Drosophila Upf1 and Upf2 loss of function inhibits cell growth and causes animal death in a Upf3-independent manner. RNA 17: 624–638. - PMC - PubMed
    1. Balistreri G, Horvath P, Schweingruber C, Zünd D, McInerney G, Merits A, Mühlemann O, Azzalin C, Helenius A. 2014. The host nonsense-mediated mRNA decay pathway restricts mammalian RNA virus replication. Cell Host Microbe 16: 403–411. - PubMed
    1. Behm-Ansmant I, Kashima I, Rehwinkel J, Sauliere J, Wittkopp N, Izaurralde E. 2007. mRNA quality control: an ancient machinery recognizes and degrades mRNAs with nonsense codons. FEBS Lett 581: 2845–2853. - PubMed

MeSH terms