. 2017 Mar 6;149(3):323-334.
doi: 10.1085/jgp.201611727. Epub 2017 Feb 16.

Doublet stimulation increases Ca2+ binding to troponin C to ensure rapid force development in skeletal muscle

Affiliations

Doublet stimulation increases Ca2+ binding to troponin C to ensure rapid force development in skeletal muscle

Anthony J Bakker et al. J Gen Physiol. .

Abstract

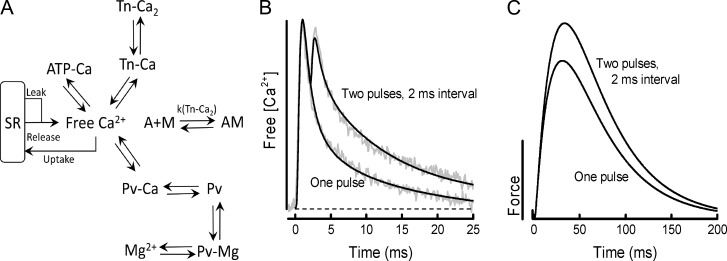
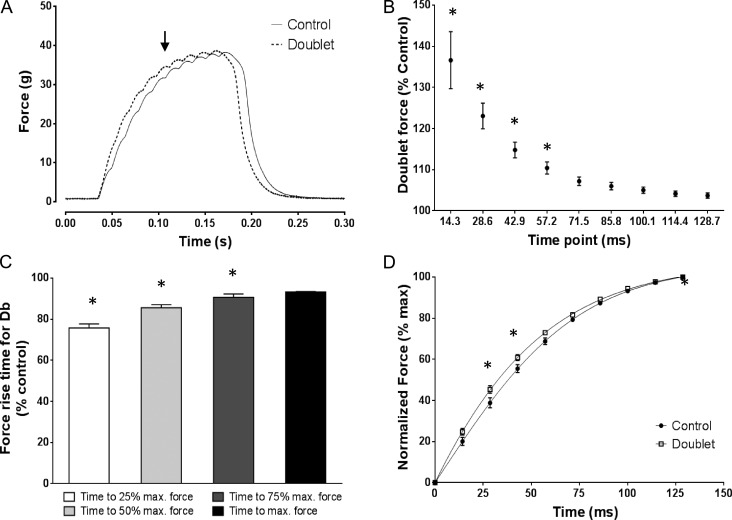
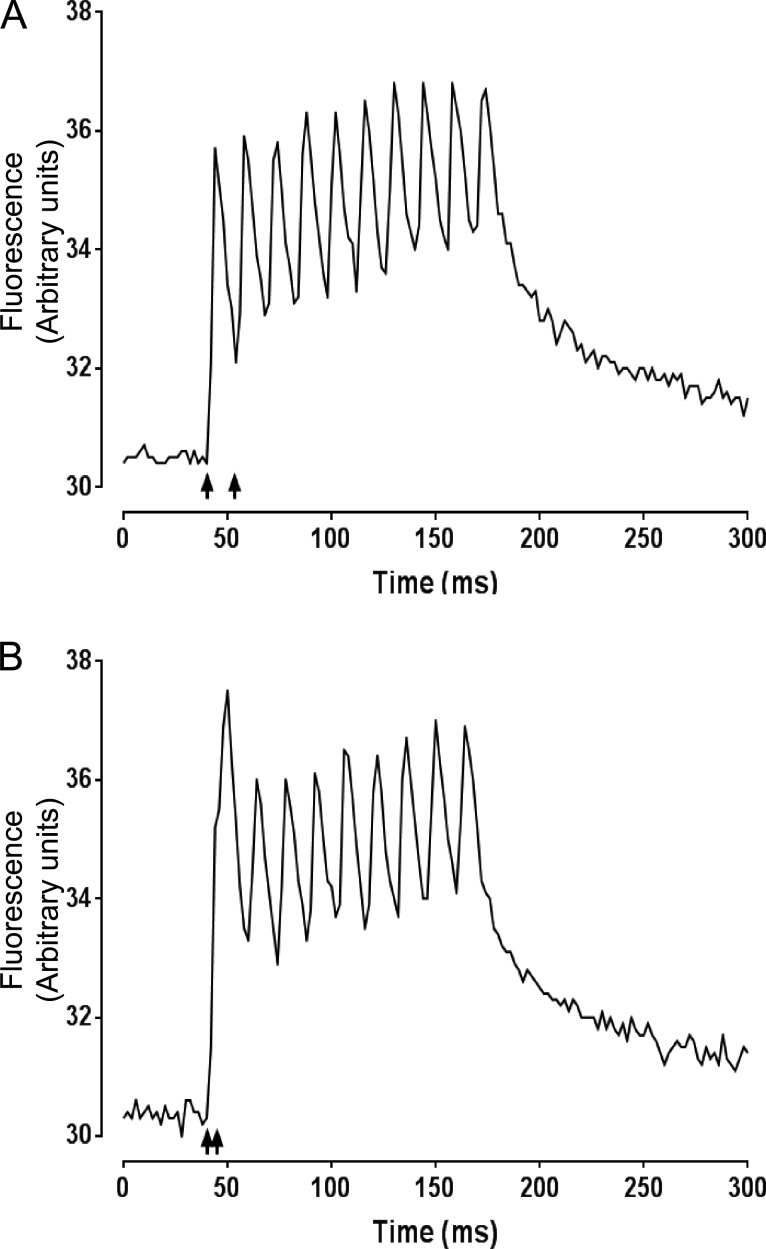
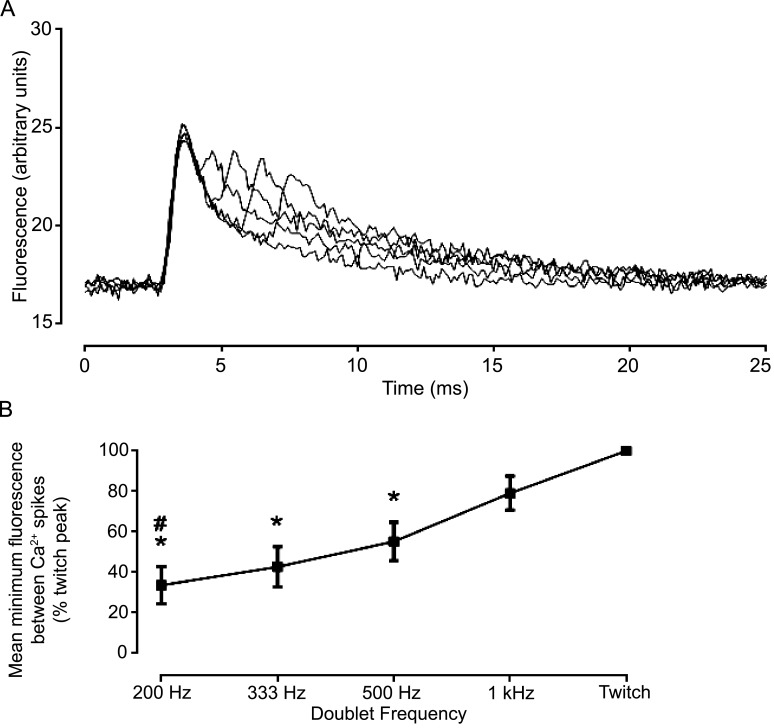
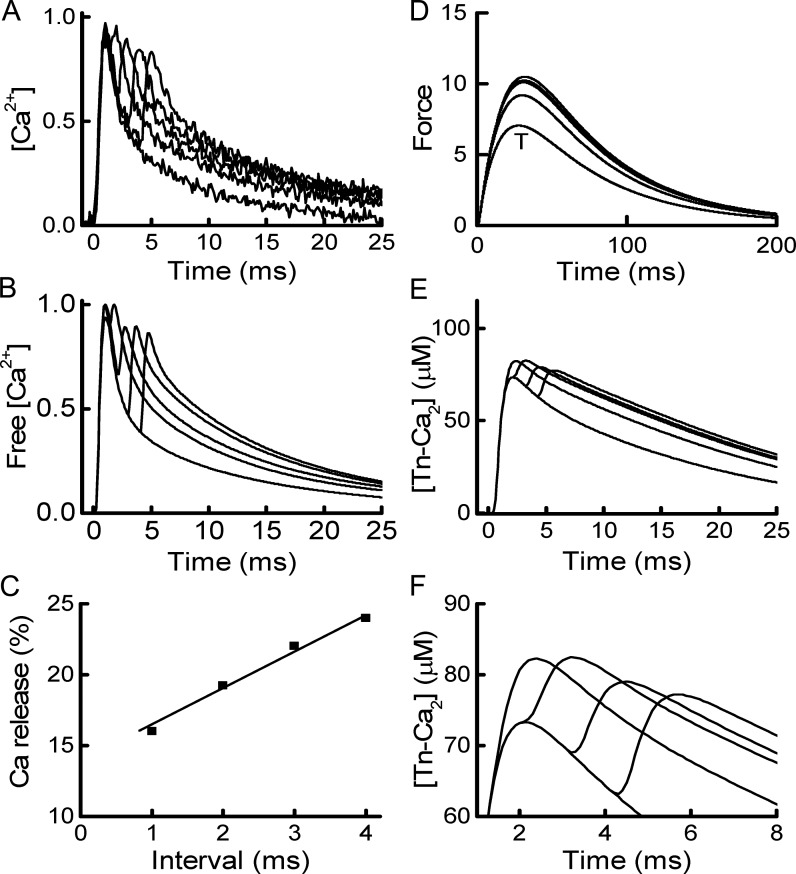
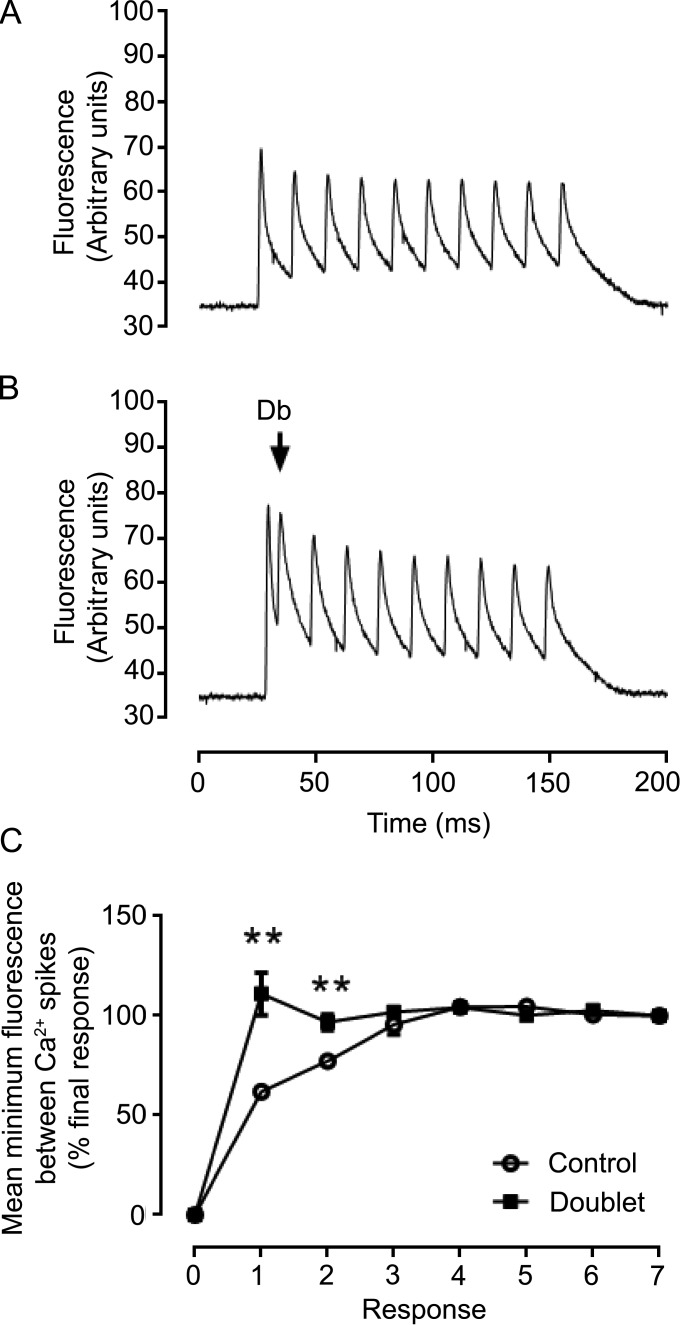
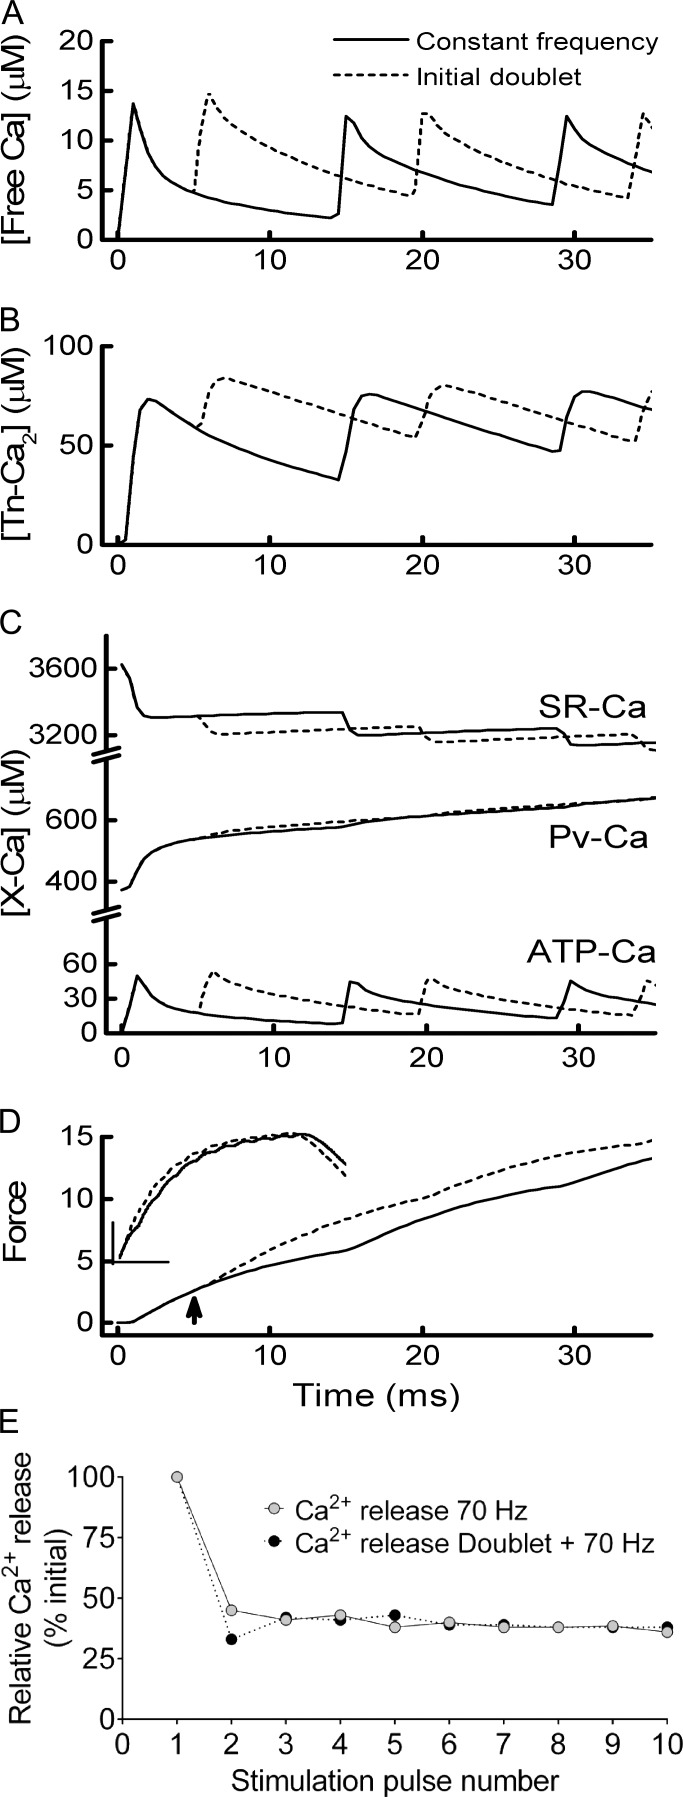
Fast-twitch skeletal muscle fibers are often exposed to motor neuron double discharges (≥200 Hz), which markedly increase both the rate of contraction and the magnitude of the resulting force responses. However, the mechanism responsible for these effects is poorly understood, likely because of technical limitations in previous studies. In this study, we measured cytosolic Ca2+ during doublet activation using the low-affinity indicator Mag-Fluo-4 at high temporal resolution and modeled the effects of doublet stimulation on sarcoplasmic reticulum (SR) Ca2+ release, binding of Ca2+ to cytosolic buffers, and force enhancement in fast-twitch fibers. Single isolated fibers respond to doublet pulses with two clear Ca2+ spikes, at doublet frequencies up to 1 KHz. A 200-Hz doublet at the start of a tetanic stimulation train (70 Hz) decreases the drop in free Ca2+ between the first three Ca2+ spikes of the transient, maintaining a higher overall free Ca2+ level during first 20-30 ms of the response. Doublet stimulation also increased the rate of force development in isolated fast-twitch muscles. We also modeled SR Ca2+ release rates during doublet stimulation and showed that Ca2+-dependent inactivation of ryanodine receptor activity is rapid, occurring ≤1ms after initial release. Furthermore, we modeled Ca2+ binding to the main intracellular Ca2+ buffers of troponin C (TnC), parvalbumin, and the SR Ca2+ pump during Ca2+ release and found that the main effect of the second response in the doublet is to more rapidly increase the occupation of the second Ca2+-binding site on TnC (TnC2), resulting in earlier activation of force. We conclude that doublet stimulation maintains high cytosolic Ca2+ levels for longer in the early phase of the Ca2+ response, resulting in faster saturation of TnC2 with Ca2+, faster initiation of cross-bridge cycling, and more rapid force development.


Figures

Figure 1.
Figure 1.
Simulation of the effects of doublet stimulation on cytosolic free Ca2+ and force production. (A) Graphical depiction of the model of Ca2+ distribution and force generation. The model incorporates both a constant Ca2+ leak and stimulus-induced, transient Ca2+ release from the SR. In the myoplasm, Ca2+ is distributed among (i) TnC (Tn), with two, sequentially filled Ca2+ binding sites, forming Tn-Ca when one Ca2+ is bound and Tn-Ca2 when both sites are occupied; (ii) parvalbumin (Pv), which has two equivalent Ca2+-binding sites per molecule that also bind Mg2+; (iii) ATP; and (iv) unbound or free Ca2+. Ca2+ is removed from the myoplasm via the SR Ca2+ pump. Force generation involves the binding of myosin cross-bridges (M) to binding sites on actin (A) to form the force-generating actomyosin complex (AM). AM formation was regulated by Tn-Ca2, which was achieved by setting the concentration of available actin sites equal to [Tn-Ca2]. (B) Comparison of recorded Ca2+ transients (gray uneven lines) and modeled free Ca transients (black smooth lines). Two records are shown, the response to a single stimulus pulse and the response to two stimulus pulses separated by 2 ms. The experimental records are the mean of records from four fibers with amplitude scaled by the maximum amplitude in response to the first stimulus pulse. (C) Simulated force responses to one pulse and to two pulses separated by 2 ms.
Figure 2.
Figure 2.
Effect of the doublet stimulation (200 Hz) on tetanic force responses elicited in intact EDL muscles. (A) An example of force traces elicited after exposure to 10 stimulation pulses at 70 Hz in the absence and presence of an initial 200-Hz doublet. The arrow shows the time point where Cheng et al. (2013) stopped stimulating their intact fiber preparation and shows why a difference in peak force was observed in that study and not the present study; i.e., force had not plateaued in Cheng et al. (2013). (B) The effect of doublet stimulation on peak force production (% control) at different time points during the tetanic force response. (C) The effect of doublet stimulation on normalized force production (% of maximal force). (D) The time taken for the doublet force response to rise to 25%, 50%, 75%, and 100% of maximum force, expressed as a percentage of the control response. Data are presented as means ± SEM. *, P < 0.05.
Figure 3.
Figure 3.
Effect of doublet stimulation on Ca2+ transients measured in interosseous fibers using Fluo-4 at a sampling frequency of 500 Hz. Arrows indicate timing of the first two stimulation pulses. (A and B) Fibers were exposed to 10 stimulation pulses at 70 Hz in the absence (A) and presence (B) of an initial 200-Hz doublet stimulation.
Figure 4.
Figure 4.
Effect of stimulation frequency on doublet-induced changes in cytoplasmic free Ca2+. (A) An overlay of a Ca2+ transient activated by a single stimulation pulse and various doublet Ca2+ transients measured at stimulation frequencies ranging from 200 Hz to 1 kHz. Measurements were made using the low-affinity Ca2+ indicator Mag-Fluo-4 and confocal line scanning at 111 µs/line. (B) The minimum fluorescence between Ca2+ spikes expressed as a percentage of the peak of the Ca2+ transient activated by a single stimulation pulse (*, significantly different to 1 kHz; #, significantly different to 500 Hz; n = 4 fiber; P < 0.05). Data are presented as means ± SEM.
Figure 5.
Figure 5.
Analysis of Ca2+ transients in response to pairs of pulses. (A) Averaged records of [Ca2+]C in response to a single pulse (lower record) and pairs of pulses at 1-, 2-, 3-, and 4-ms intervals. Each record is the mean of records from four fibers normalized by peak value in response to first stimulus. (B) Simulated time courses of free [Ca2+] in response to the same stimulus patterns used for A. (C) Amount of Ca2+ released in response to second stimulus expressed relative to that released by first pulse. (D) Simulated time courses of force output in response to a single stimulus (labeled “T”) or pairs of pulses (upper traces). Note the different time scale to other graphs. (E) Simulated time courses of the concentration of TnC with two Ca2+ bound (Tn-Ca2). The total concentration of sites is 120 µM. (F) Detail from E, highlighting the increase in [Tn-Ca2]. Provision of a second stimulus increased above that achieved in a twitch and close to saturation (i.e., [Tn-Ca2] = 120 µM).
Figure 6.
Figure 6.
The effect of doublet stimulation (200 Hz) on Ca2+ transients measured in interosseous fibers using Mag-Fluo-4 (sampling every 111 µs) during tetanic activation at 70 Hz. (A) Stimulation at 70 Hz resulted in Ca2+ transients that exhibited a larger initial Ca2+ spike, after which peak Ca2+ gradually decreased to a uniform lower level. The minimum fluorescence values between Ca2+ spikes (expressed as a percentage of the minimum fluorescence between the final two Ca2+ spikes in the Ca2+ transient) gradually increased to a plateau. (B) The presence of a doublet (Db), indicated by the arrow, produced two clear Ca2+ spikes in response to the doublet action potentials, but had no effect on peak Ca2+. (B and C) Doublet stimulation resulted in a persistent increase in the minimum fluorescence values between the initial three Ca2+ spikes (**, significantly different to control, P < 0.01). Data are presented as means ± SEM.
Figure 7.
Figure 7.
Simulated responses to constant frequency and doublet stimulation. Simulations of constant frequency stimulation (70 Hz) are shown with solid lines, and simulations of the response to doublet stimulation (two pulses at 200 Hz followed by eight at 70 Hz) are shown with broken lines. (A) Free Ca2+. The time scale encompasses the first three stimuli only. (B) Concentration of TnC with both Ca2+-binding regulatory sites occupied by Ca2+. (C) Concentration of Ca2+ in the SR and bound to parvalbumin (Pv) and bound to ATP. (D) Force output during the initial force development. The more rapid force development in response to the doublet stimulation is apparent. The arrow indicates the time at which the second stimulus was delivered in the doublet protocol. The inset shows the time course of force development for 150 ms after the first stimulus, encompassing all 10 stimuli delivered. (E) SR Ca2+ release as a percentage of initial Ca2+ release in response to constant frequency and doublet stimulation during the 10-pulse tetanic stimulus.

Comment in

Similar articles

Cited by

References

    1. Abbate F., Bruton J.D., De Haan A., and Westerblad H.. 2002. Prolonged force increase following a high-frequency burst is not due to a sustained elevation of [Ca2+]i. Am. J. Physiol. Cell Physiol. 283:C42–C47. 10.1152/ajpcell.00416.2001 - DOI - PubMed
    1. Ashley C.C., and Moisescu D.G.. 1972. Model for the action of calcium in muscle. Nat. New Biol. 237:208–211. 10.1038/newbio237208a0 - DOI - PubMed
    1. Bakker A.J., Head S.I., Williams D.A., and Stephenson D.G.. 1993. Ca2+ levels in myotubes grown from the skeletal muscle of dystrophic (mdx) and normal mice. J. Physiol. 460:1–13. 10.1113/jphysiol.1993.sp019455 - DOI - PMC - PubMed
    1. Barclay C.J. 2012. Quantifying Ca2+ release and inactivation of Ca2+ release in fast- and slow-twitch muscles. J. Physiol. 590:6199–6212. 10.1113/jphysiol.2012.242073 - DOI - PMC - PubMed
    1. Barclay C.J. 2015. Energetics of contraction. Compr. Physiol. 5:961–995. 10.1002/cphy.c140038 - DOI - PubMed