

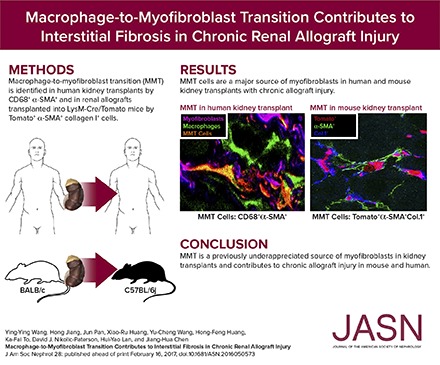
Macrophage-to-Myofibroblast Transition Contributes to Interstitial Fibrosis in Chronic Renal Allograft Injury
- PMID: 28209809
- PMCID: PMC5491278
- DOI: 10.1681/ASN.2016050573
Macrophage-to-Myofibroblast Transition Contributes to Interstitial Fibrosis in Chronic Renal Allograft Injury
Abstract
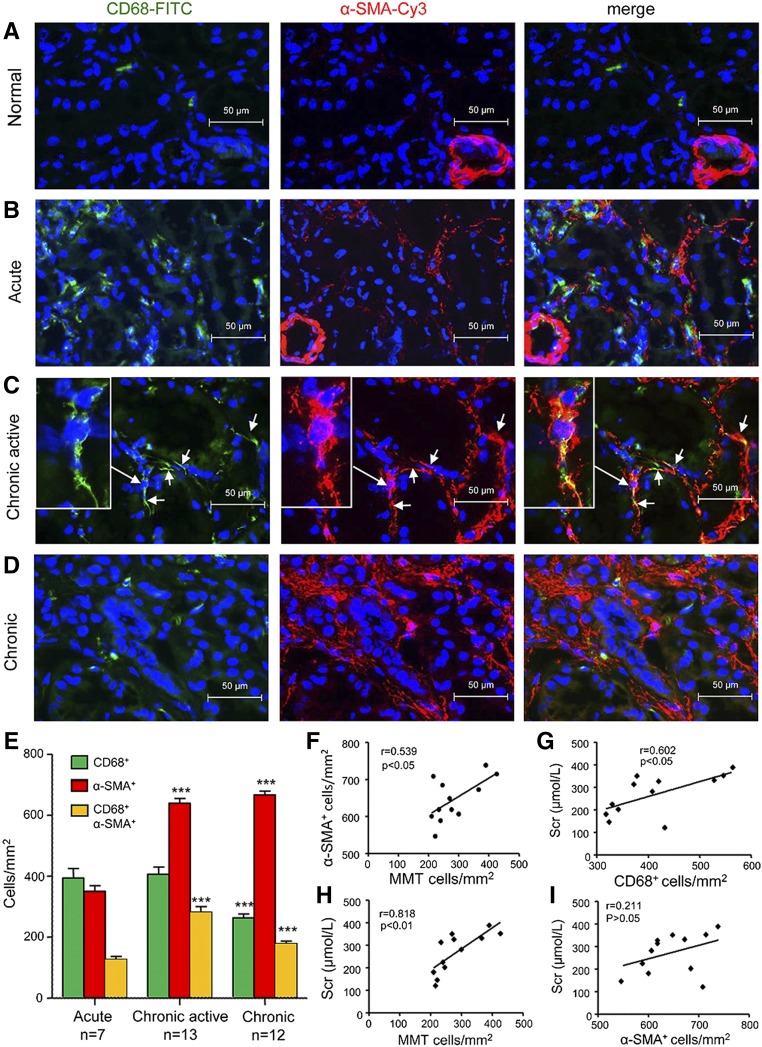
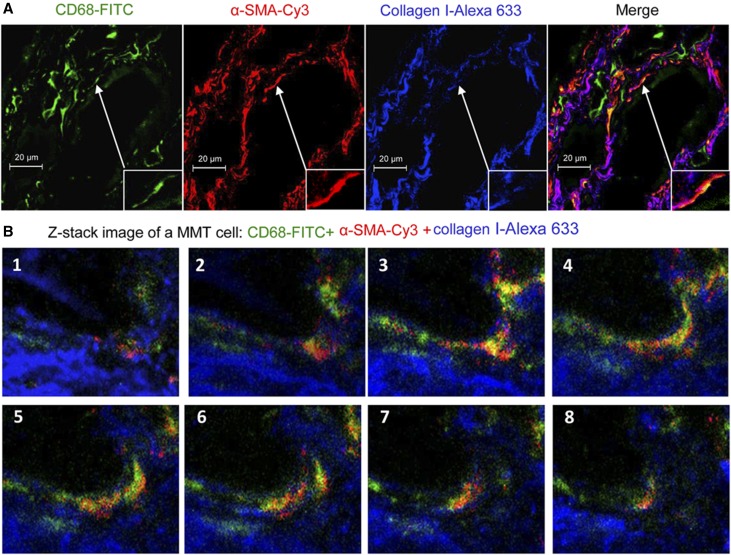
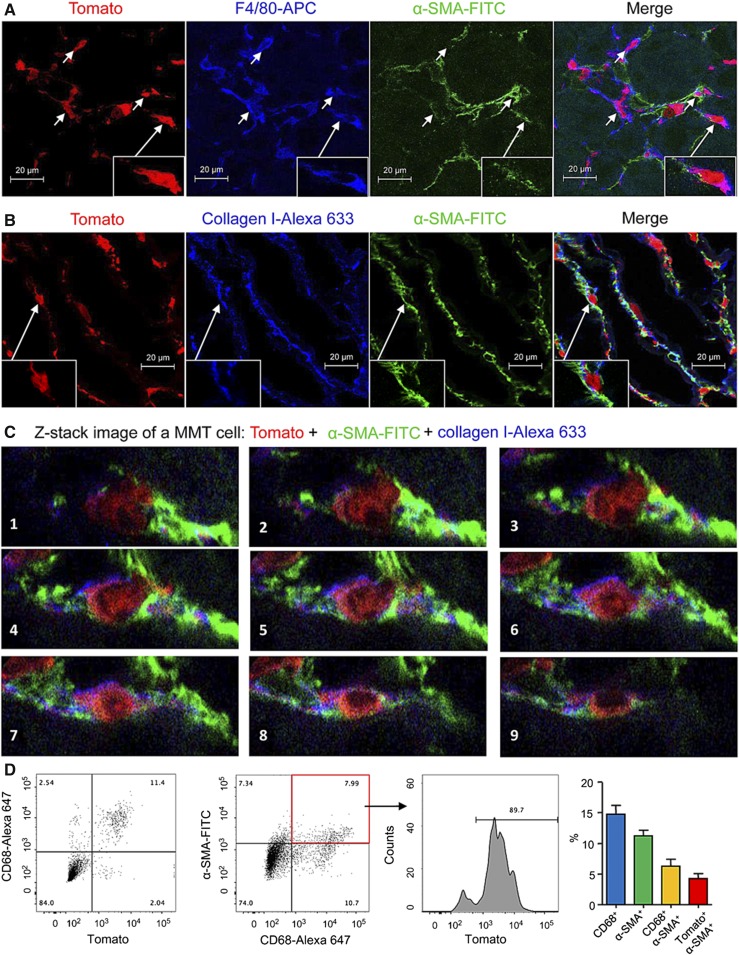
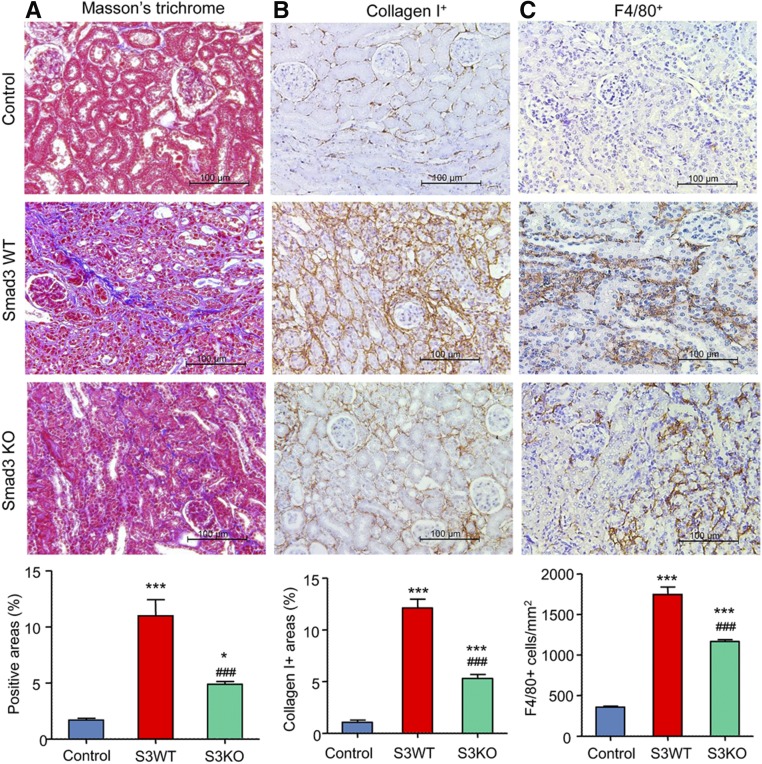
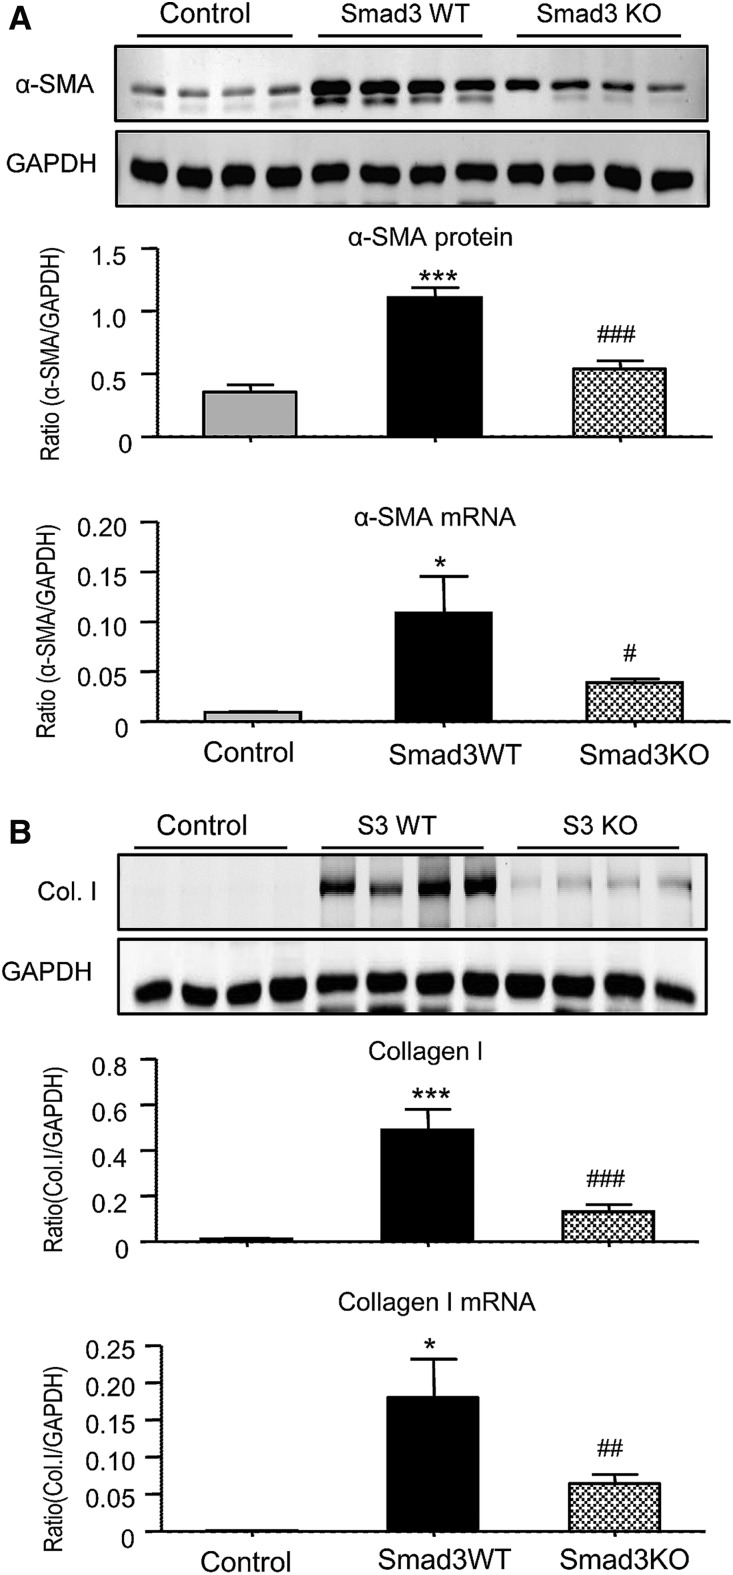
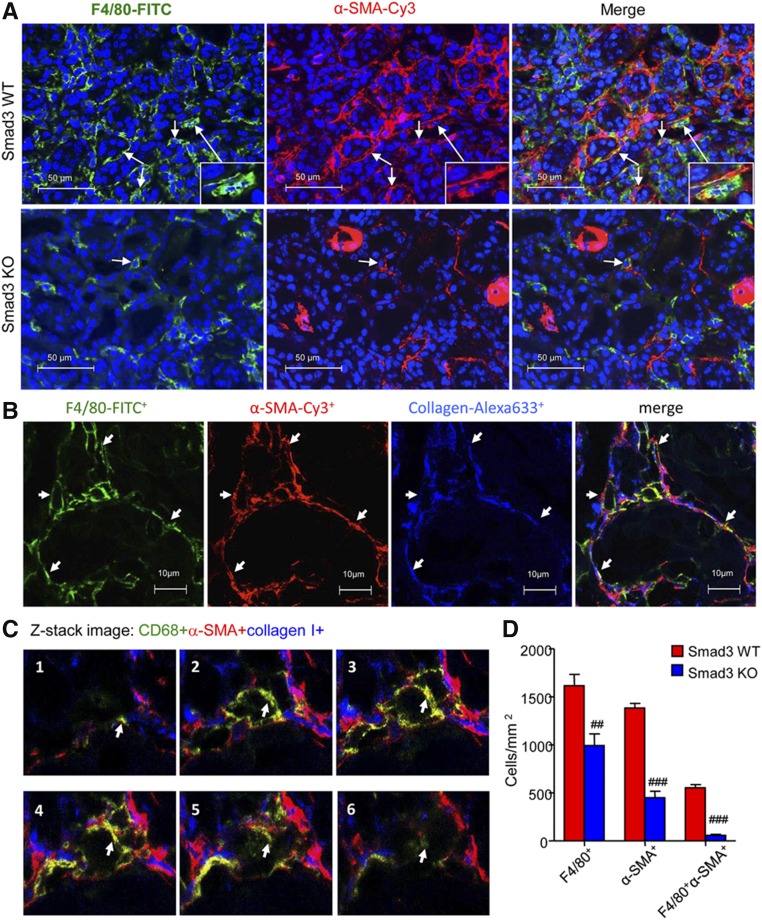
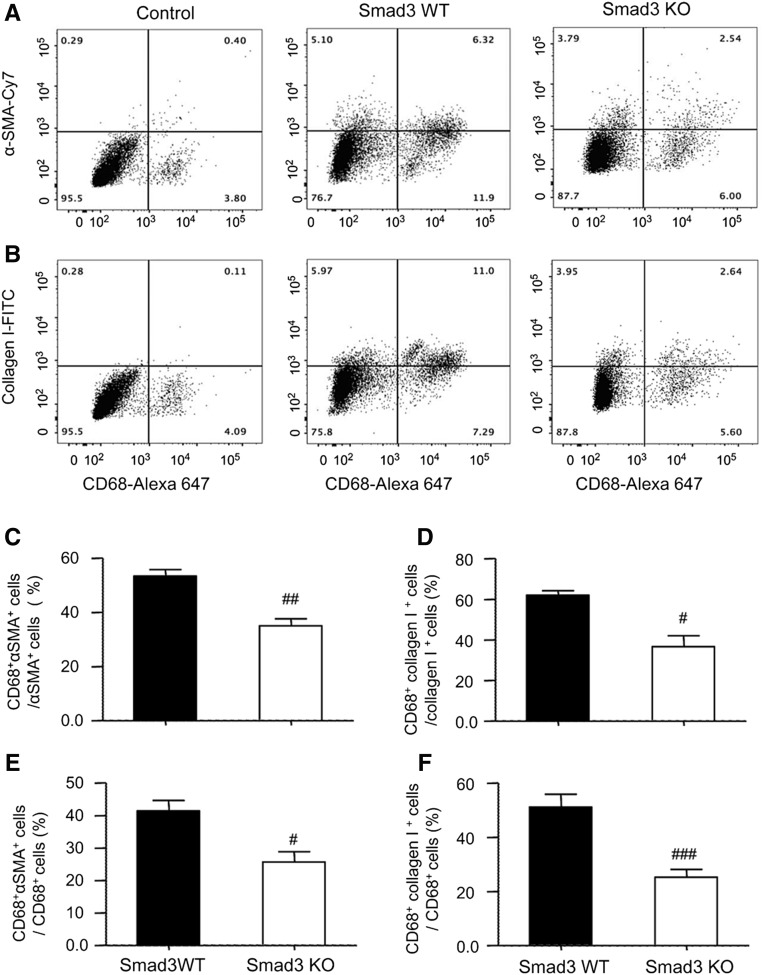
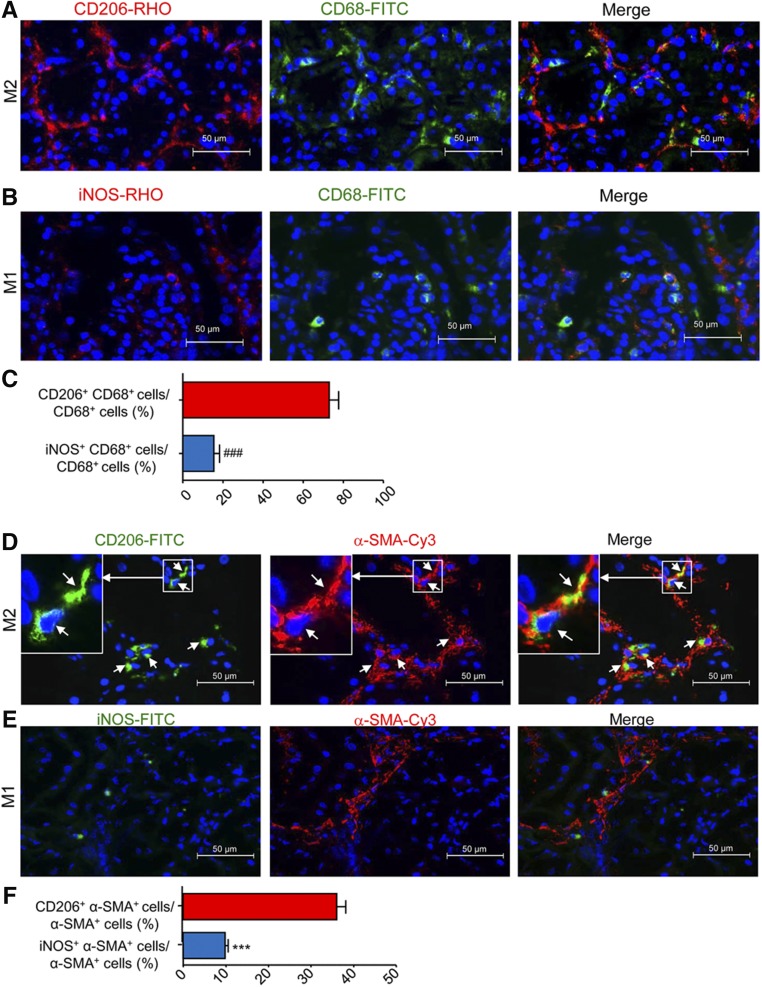
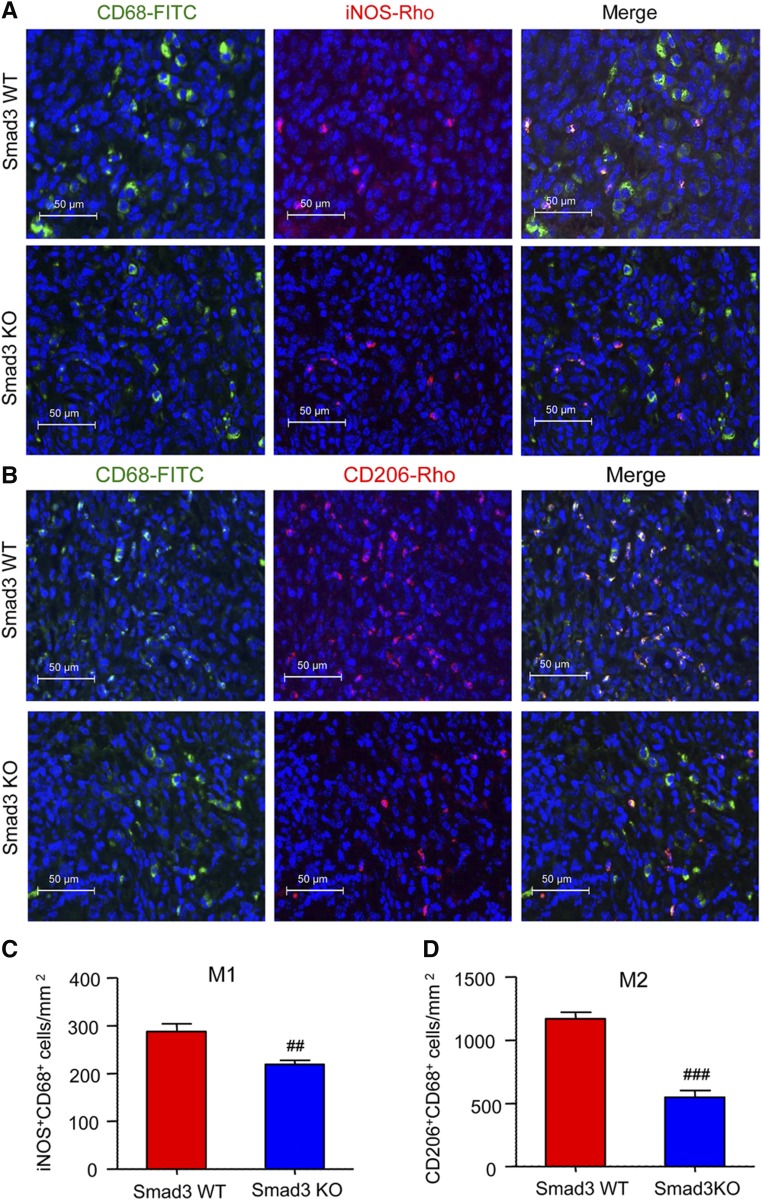
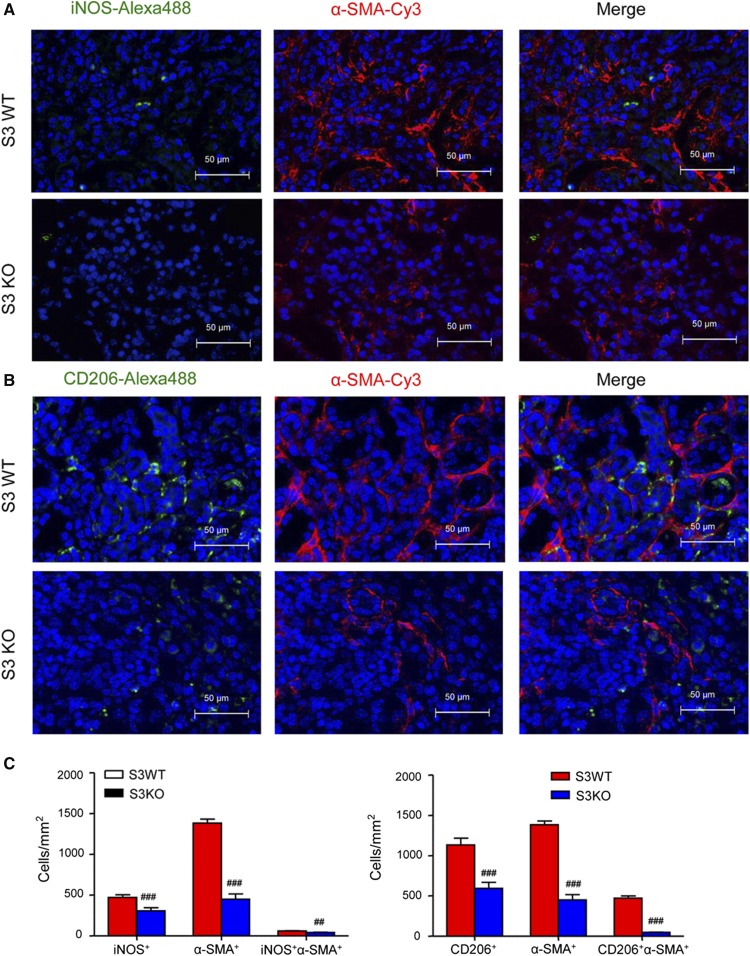
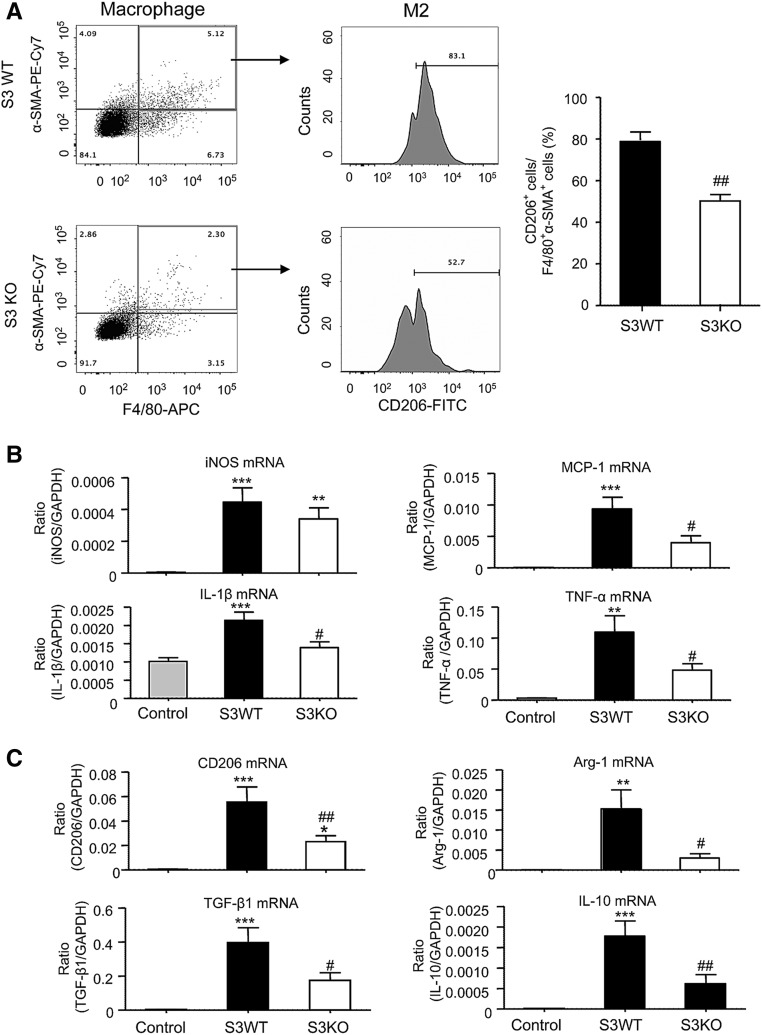
Interstitial fibrosis is an important contributor to graft loss in chronic renal allograft injury. Inflammatory macrophages are associated with fibrosis in renal allografts, but how these cells contribute to this damaging response is not clearly understood. Here, we investigated the role of macrophage-to-myofibroblast transition in interstitial fibrosis in human and experimental chronic renal allograft injury. In biopsy specimens from patients with active chronic allograft rejection, we identified cells undergoing macrophage-to-myofibroblast transition by the coexpression of macrophage (CD68) and myofibroblast (α-smooth muscle actin [α-SMA]) markers. CD68+/α-SMA+ cells accounted for approximately 50% of the myofibroblast population, and the number of these cells correlated with allograft function and the severity of interstitial fibrosis. Similarly, in C57BL/6J mice with a BALB/c renal allograft, cells coexpressing macrophage markers (CD68 or F4/80) and α-SMA composed a significant population in the interstitium of allografts undergoing chronic rejection. Fate-mapping in Lyz2-Cre/Rosa26-Tomato mice showed that approximately half of α-SMA+ myofibroblasts in renal allografts originated from recipient bone marrow-derived macrophages. Knockout of Smad3 protected against interstitial fibrosis in renal allografts and substantially reduced the number of macrophage-to-myofibroblast transition cells. Furthermore, the majority of macrophage-to-myofibroblast transition cells in human and experimental renal allograft rejection coexpressed the M2-type macrophage marker CD206, and this expression was considerably reduced in Smad3-knockout recipients. In conclusion, our studies indicate that macrophage-to-myofibroblast transition contributes to interstitial fibrosis in chronic renal allograft injury. Moreover, the transition of bone marrow-derived M2-type macrophages to myofibroblasts in the renal allograft is regulated via a Smad3-dependent mechanism.
Keywords: M2 macrophage; Smad3; chronic allograft rejection; interstitial fibrosis; lineage tracing; macrophage myofibroblast transition.
Copyright © 2017 by the American Society of Nephrology.
Figures
References
-
- Boor P, Floege J: Renal allograft fibrosis: Biology and therapeutic targets. Am J Transplant 15: 863–886, 2015 - PubMed
-
- Racusen LC, Regele H: The pathology of chronic allograft dysfunction. Kidney Int Suppl 78: S27–S32, 2010 - PubMed
-
- Haas M: Chronic allograft nephropathy or interstitial fibrosis and tubular atrophy: What is in a name? Curr Opin Nephrol Hypertens 23: 245–250, 2014 - PubMed
-
- Eddy AA: The origin of scar-forming kidney myofibroblasts. Nat Med 19: 964–966, 2013 - PubMed
MeSH terms
LinkOut - more resources
Full Text Sources
Other Literature Sources
Medical
