. 2017 Apr;173(4):2029-2040.
doi: 10.1104/pp.16.00060. Epub 2017 Feb 16.

Salicylic Acid-Dependent Plant Stress Signaling via Mitochondrial Succinate Dehydrogenase

Affiliations

Salicylic Acid-Dependent Plant Stress Signaling via Mitochondrial Succinate Dehydrogenase

Katharina Belt et al. Plant Physiol. 2017 Apr.

Abstract

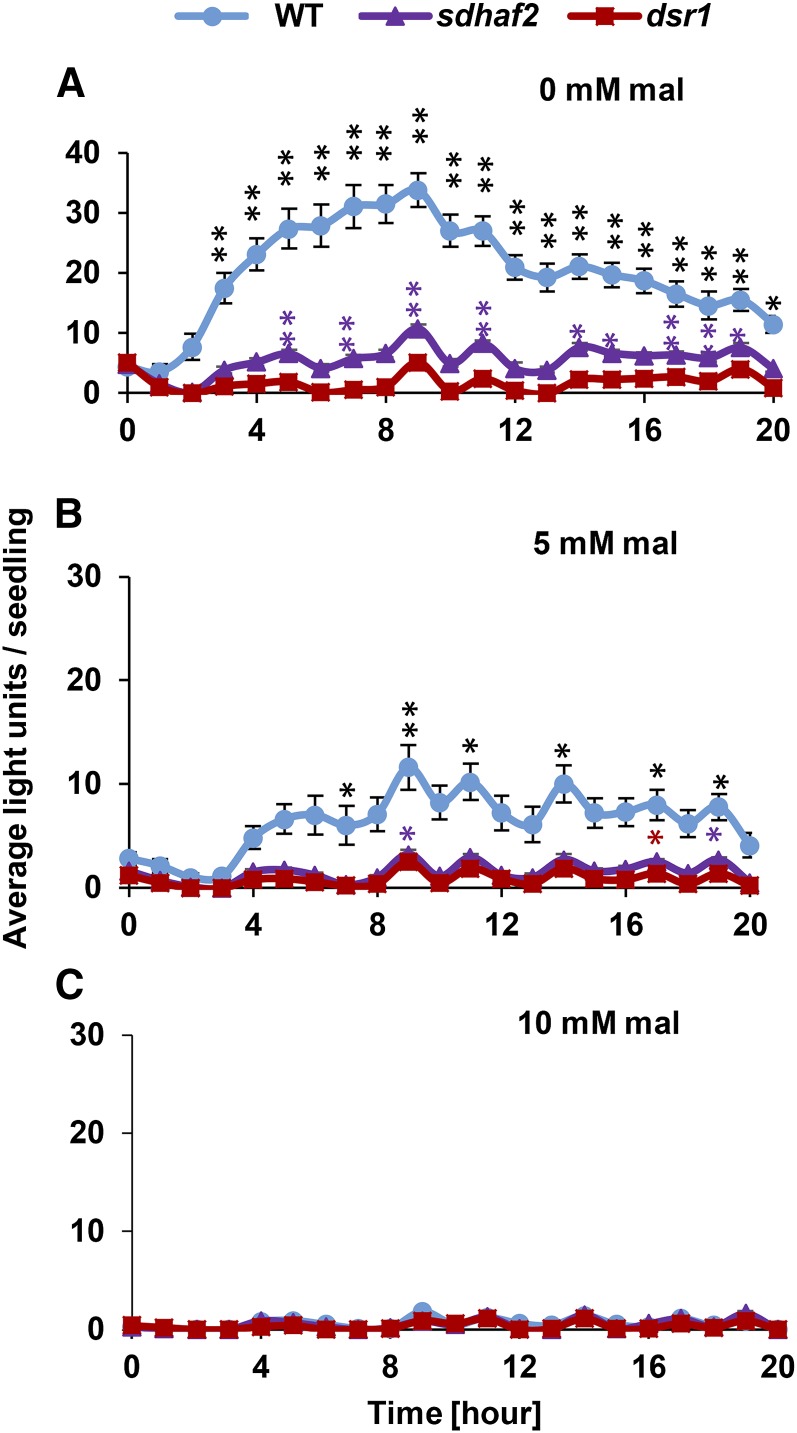
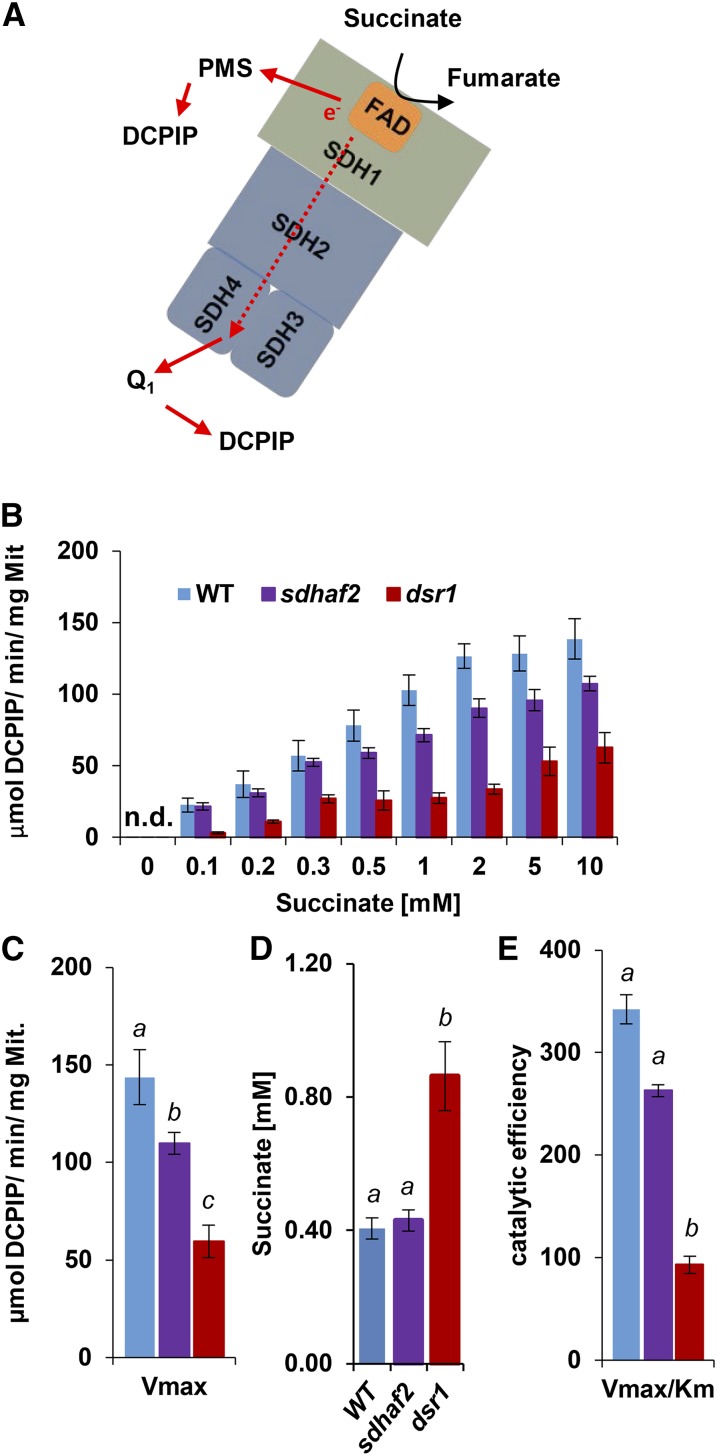
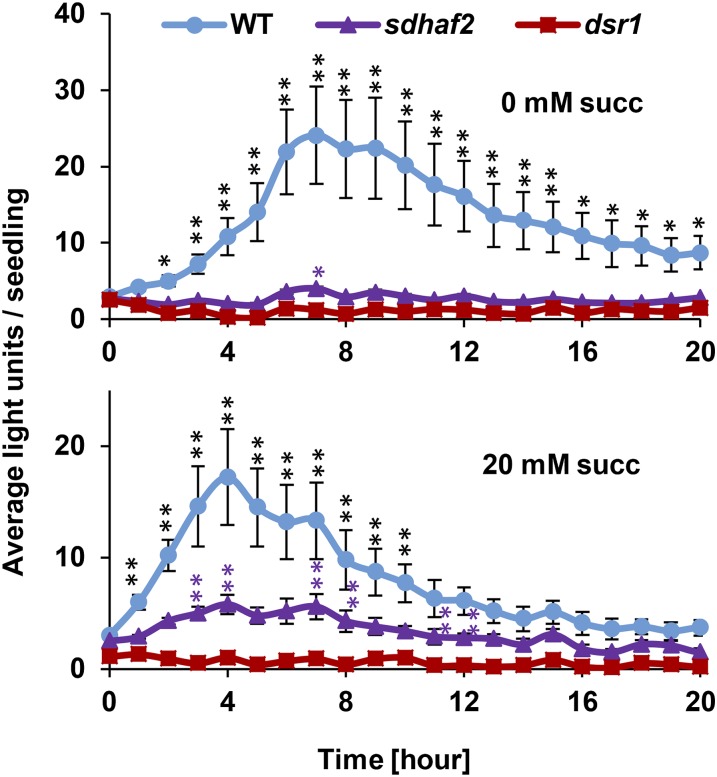
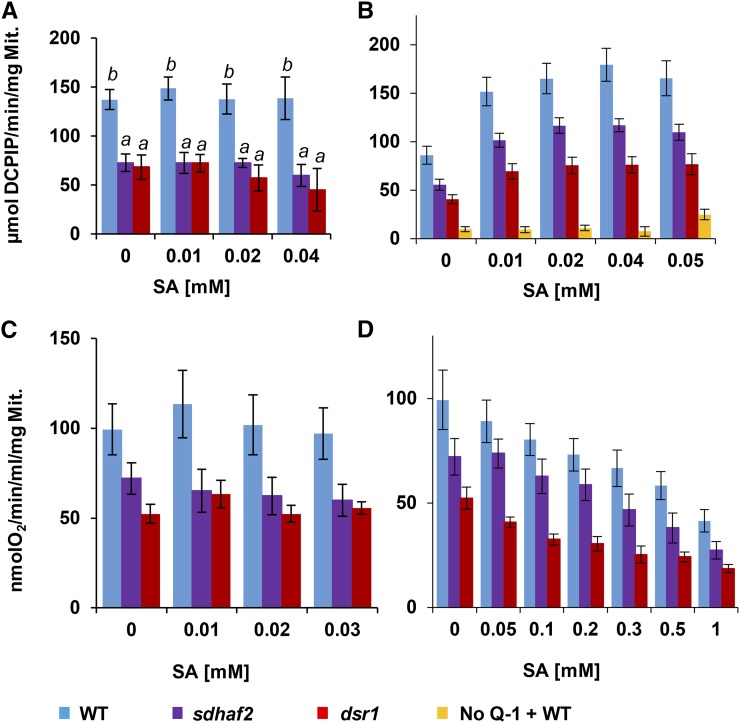
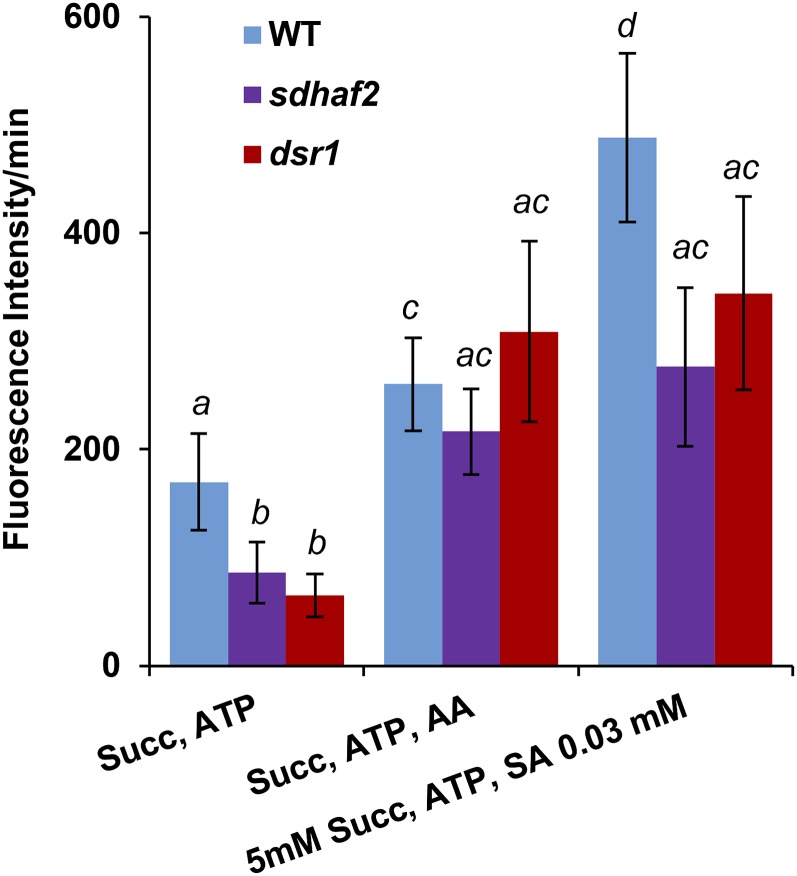
Mitochondria are known for their role in ATP production and generation of reactive oxygen species, but little is known about the mechanism of their early involvement in plant stress signaling. The role of mitochondrial succinate dehydrogenase (SDH) in salicylic acid (SA) signaling was analyzed using two mutants: disrupted in stress response1 (dsr1), which is a point mutation in SDH1 identified in a loss of SA signaling screen, and a knockdown mutant (sdhaf2) for SDH assembly factor 2 that is required for FAD insertion into SDH1. Both mutants showed strongly decreased SA-inducible stress promoter responses and low SDH maximum capacity compared to wild type, while dsr1 also showed low succinate affinity, low catalytic efficiency, and increased resistance to SDH competitive inhibitors. The SA-induced promoter responses could be partially rescued in sdhaf2, but not in dsr1, by supplementing the plant growth media with succinate. Kinetic characterization showed that low concentrations of either SA or ubiquinone binding site inhibitors increased SDH activity and induced mitochondrial H2O2 production. Both dsr1 and sdhaf2 showed lower rates of SA-dependent H2O2 production in vitro in line with their low SA-dependent stress signaling responses in vivo. This provides quantitative and kinetic evidence that SA acts at or near the ubiquinone binding site of SDH to stimulate activity and contributes to plant stress signaling by increased rates of mitochondrial H2O2 production, leading to part of the SA-dependent transcriptional response in plant cells.


Figures

Figure 1.
Figure 1.
GSTF8:luc induction in sdhaf2 and dsr1 after SA treatment compared to wild type. Average of total fluorescence signal generated by each seedling (n = 10) per hour after treatment of 7 mm SA in the presence of 0 mm (A), 5 mm (B), and 10 mm (C) malonate (mal) in the growth media. Two-factor ANOVA between genotypes (P ≤ 0.01), posthoc Tukey test comparing signal induction to time point zero within genotype *P ≤ 0.05; **P ≤ 0.01.
Figure 2.
Figure 2.
Lower succinate affinity and catalytic efficiency in dsr1. Concentrations of 0.1 to 10 mm of succinate were used to calculate maximal SDH activity, measured as absorbance change of DCPIP at 600 nm. Km was calculated using Hanes-Plot and Brook Kinetics Software. A, Scheme of SDH showing electron transfer from succinate to UQ binding site. B, Correlation of SDH activity and succinate concentrations of the wild type, sdhaf2, and dsr1. C, Maximal enzyme velocity (Vmax). D, Calculated Km of succinate using Brooks kinetic software. E, enzymatic efficiency (Vmax/Km) for sdhaf2 and dsr1. se of six biological replicates. Two-factor ANOVA comparing SDH activity between genotypes (B) P ≤ 0.01 (dsr1 compared to the wild type and sdhaf2). Single-factor ANOVA comparing catalytic efficiency and succinate affinity (D and E) between genotypes. Different letters indicate significant differences (P ≤ 0.05) between genotypes. n.d., Not detected.
Figure 3.
Figure 3.
IC50 of SDH competitive inhibitors malonate and oxaloacetate are higher in dsr1. Inhibition of SDH was measured using increasing amounts of malonate and OAA together with the Km concentration of succinate (0.5 mm for wild type and sdhaf2; 1 mm for dsr1). IC50 was calculated using Brooks Kinetic Software. A, Percentage inhibition of SDH activity in the presence of malonate and OAA. B, Calculated IC50 of malonate (left) and OAA (right). se of four biological replicates. Single-factor ANOVA comparing IC50 between genotypes. Different letters indicate significant differences, P ≤ 0.07.
Figure 4.
Figure 4.
SA-induced GSTF8 signal can be rescued in sdhaf2 using high concentrations of succinate. Average of total fluorescence signal generated by each seedling (n = 10) per hour after treatment of 7 mm SA in the presence of 0 (top) and 20 mm succinate (succ, bottom) in the growth media. Error bars: se, posthoc Tukey test comparing signal induction to time point zero within genotype, *P ≤ 0.05, **P ≤ 0.01.
Figure 5.
Figure 5.
Low concentrations of SA increase SQR activity. A, SDH activity measured at the succinate binding site (PMS + DCPIP) in the presence of SA. B, SQR activity measured at UQ binding site (Q1 [80 µm] + DCPIP) in the presence of SA. As a negative control, activity was measured in the absence of Q1 in wild-type mitochondria (yellow bars). In both cases, SDH activity was measured in µmol DCPIP/min/mg Mit. in the presence of 5 mm succinate and SA concentrations ranging from 0.01 to 0.05 mm. C and D, Succinate-dependent oxygen consumption was measured using a Clark type oxygen electrode in the presence of 5 mm succinate and SA concentrations ranging from 0.01 to 1 mm. Fisher’s lsd test was used to determine differences (different letters indicate significant differences; for P values and letter distribution, see Supplemental Table S1 and Supplemental Fig. S3); P ≤ 0.05.
Figure 6.
Figure 6.
mtH2O2 production is lower in dsr1 and sdhaf2. mtH2O2 production was measured using DCFDA with excitation/emission wavelengths of 490/520 nm. Succinate (5 mm), 0.5 mm ATP, 5 µm AA, and 0.03 mm SA were added to freshly isolated mitochondria immediately before the measurement. Fluorescence intensity was measured over 10 min and the rate of fluorescence/min was calculated. se of eight biological replicates. Wilcoxon signed rank test between genotypes, different letters indicate significant differences, P ≤ 0.05.

References

    1. Andreyev AY, Kushnareva YE, Starkov AA (2005) Mitochondrial metabolism of reactive oxygen species. Biochemistry (Mosc) 70: 200–214 - PubMed
    1. Attaran E, Zeier TE, Griebel T, Zeier J (2009) Methyl salicylate production and jasmonate signaling are not essential for systemic acquired resistance in Arabidopsis. Plant Cell 21: 954–971 - PMC - PubMed
    1. Bi YM, Kenton P, Mur L, Darby R, Draper J (1995) Hydrogen peroxide does not function downstream of salicylic acid in the induction of PR protein expression. Plant J 8: 235–245 - PubMed
    1. Bienert GP, Chaumont F (2014) Aquaporin-facilitated transmembrane diffusion of hydrogen peroxide. Biochim Biophys Acta 1840: 1596–1604 - PubMed
    1. Bienert GP, Møller AL, Kristiansen KA, Schulz A, Møller IM, Schjoerring JK, Jahn TP (2007) Specific aquaporins facilitate the diffusion of hydrogen peroxide across membranes. J Biol Chem 282: 1183–1192 - PubMed

Publication types

MeSH terms