. 2017 Feb 17;355(6326):eaah6171.
doi: 10.1126/science.aah6171.

Lipid transport by TMEM24 at ER-plasma membrane contacts regulates pulsatile insulin secretion

Affiliations

Lipid transport by TMEM24 at ER-plasma membrane contacts regulates pulsatile insulin secretion

Joshua A Lees et al. Science. .

Abstract

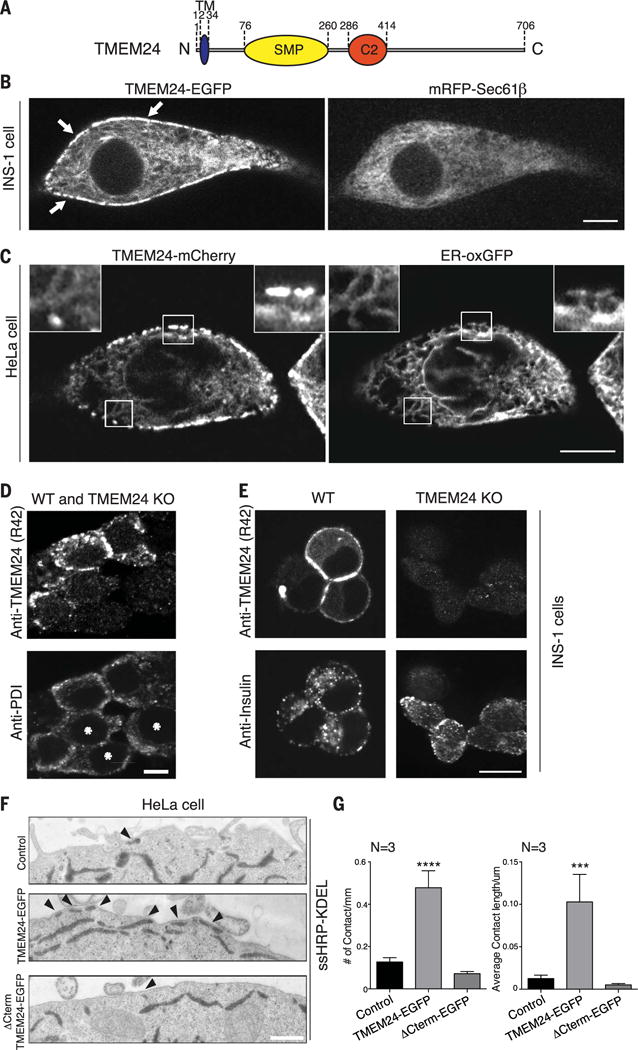
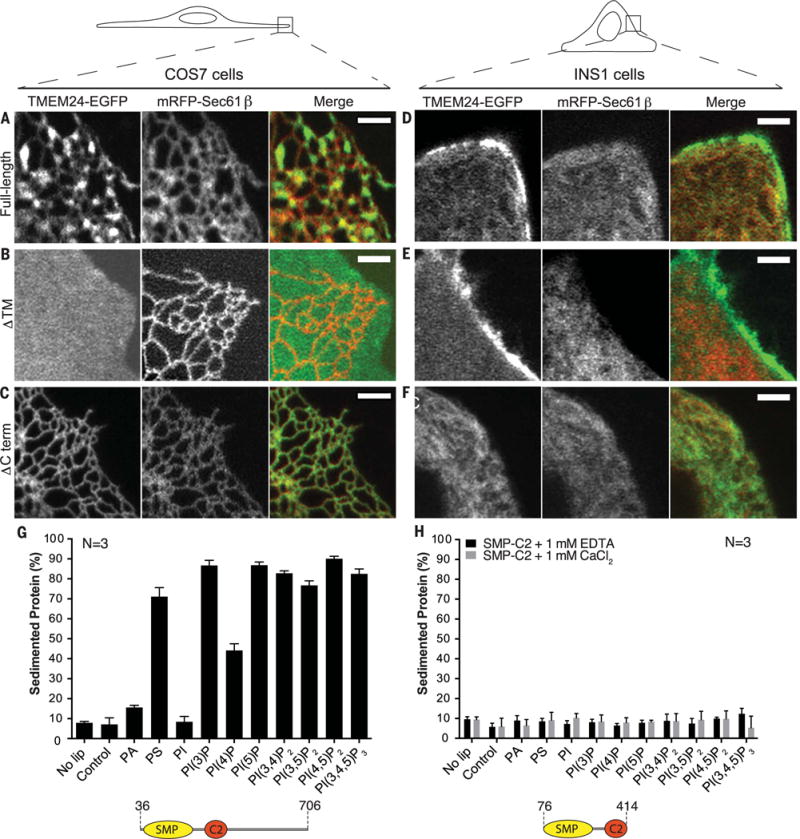
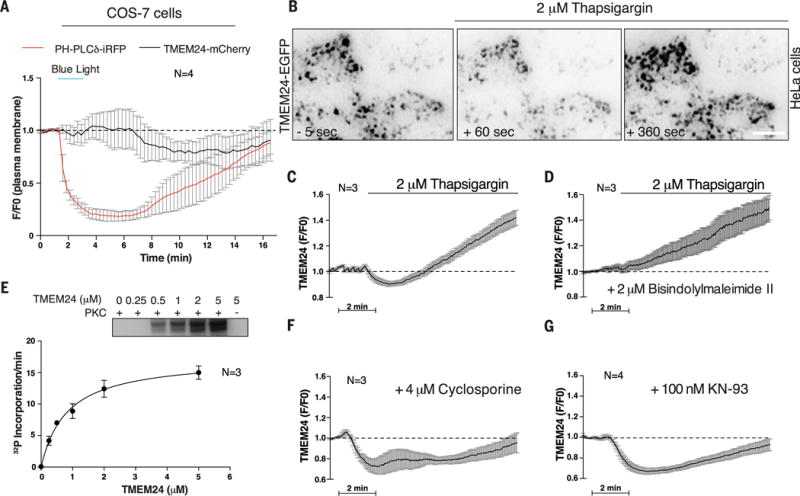
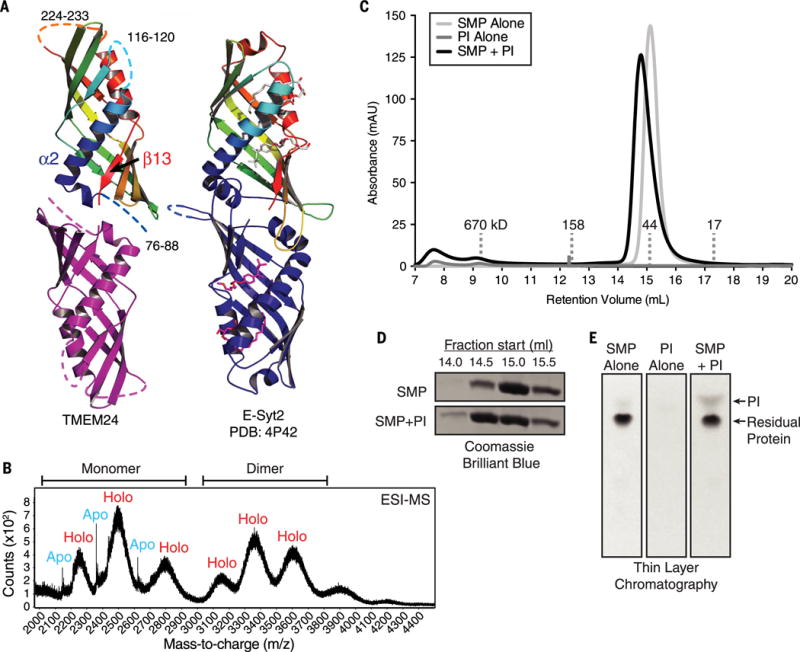
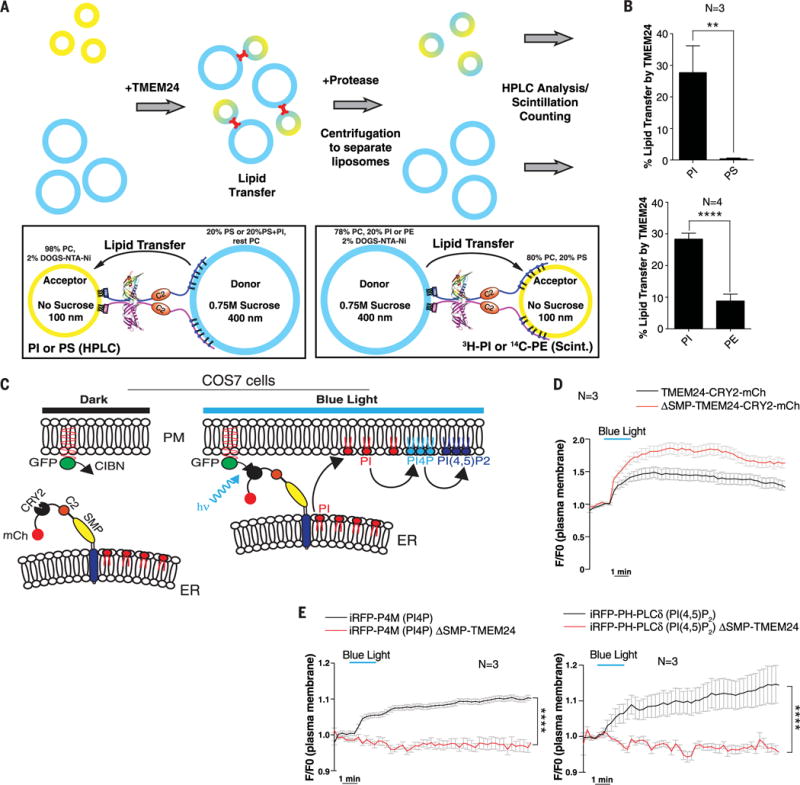
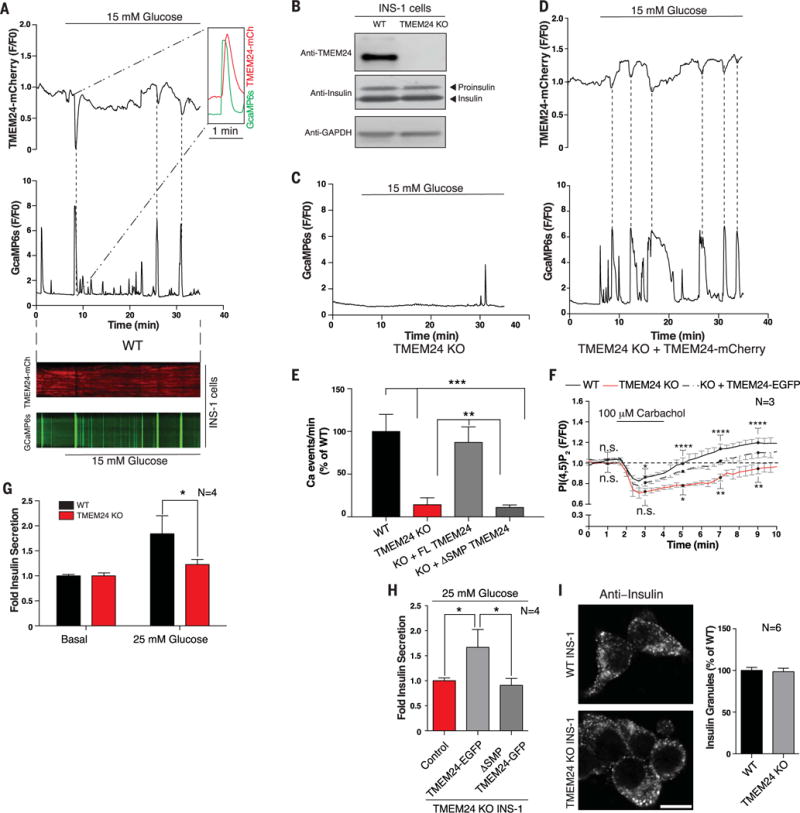
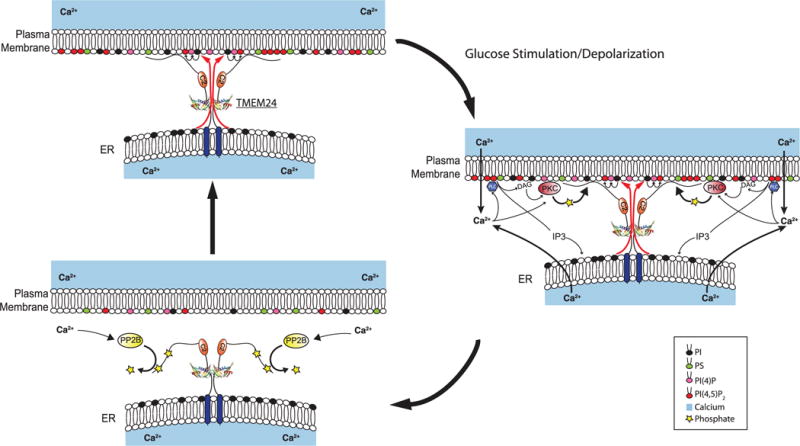
Insulin is released by β cells in pulses regulated by calcium and phosphoinositide signaling. Here, we describe how transmembrane protein 24 (TMEM24) helps coordinate these signaling events. We showed that TMEM24 is an endoplasmic reticulum (ER)-anchored membrane protein whose reversible localization to ER-plasma membrane (PM) contacts is governed by phosphorylation and dephosphorylation in response to oscillations in cytosolic calcium. A lipid-binding module in TMEM24 transports the phosphatidylinositol 4,5-bisphosphate [PI(4,5)P2] precursor phosphatidylinositol between bilayers, allowing replenishment of PI(4,5)P2 hydrolyzed during signaling. In the absence of TMEM24, calcium oscillations are abolished, leading to a defect in triggered insulin release. Our findings implicate direct lipid transport between the ER and the PM in the control of insulin secretion, a process impaired in patients with type II diabetes.


Figures

Fig. 1
Fig. 1. TMEM24 is a tether at endoplasmic reticulum (ER)–plasma membrane (PM) contact sites
(A) Schematic representation of TMEM24. (B) Overexpression of human TMEM24-EGFP in INS-1 insulinoma cells monitored by confocal microscopy. TMEM24-EGFP partially colocalizes with ER marker mRFP-Sec61β throughout the ER and is additionally concentrated at hot spots at the cell periphery (arrows), as expected for ER-PM contact sites. (C) Overexpression of TMEM24-mCherry in HeLa cells monitored by confocal microscopy. TMEM24-mCherry colocalizes with ER marker ER-oxGFP throughout the reticular and cortical ER but is greatly enriched in the cortical ER (right insets). (D) Immunofluorescence for TMEM24 and ER marker PDI in mixed TMEM24 KO (asterisks) and WT INS-1 insulinoma cells. TMEM24 mainly localizes to the periphery of the cells. (E) Immunofluorescence for TMEM24 and insulin in WT and TMEM24 KO INS-1 cells. TMEM24 immunoreactivity is only observed in WT cells, is concentrated at the cell periphery, and does not colocalize with insulin granules. (F) Representative EM images of HeLa cells transfected with ssHRP-KDEL alone or with full-length TMEM24-EGFP or ΔCTerm TMEM24-EGFP. Arrowheads indicate ER-PM contacts. Note the increase in contact site number after overexpression of TMEM24-EGFP. (G) Quantitation of experiments described in Fig. 1F. Number (left panel; mean ± SEM) and average length (right panel; mean ± SEM) of ER-PM contacts increases relative to control only when full-length TMEM24 is overexpressed. Scale bars are 5 μm for (B) and (D), 10 μm for (C), and 200 nm for (F). P values are <0.0001 and 0.0002 for (F) left and right panels, respectively.
Fig. 2
Fig. 2. TMEM24 N-terminal TM domain and C-terminal unstructured region are required for localization to ER-PM contacts
(A to F) Comparative analysis of localization of full-length, ΔTM, and ΔCTerm TMEM24-EGFP when overexpressed in COS-7 [(A) to (C)] and INS-1 [(D) to (F)] cells monitored by confocal microscopy. mRFP-Sec61β was used as ER marker. Given the different shape of the two cell types (top drawings), the plasma membrane was observed “en face” in the thin lamellipodium of the COS-7 cells but in cross section in the INS-1 cell. Full-length TMEM24 [(A) and (D)] has a diffuse localization in the ER but clusters at hot spots that represent ER-PM contact sites. The reticular shape of the ER is optimally appreciated in the “en face” view of the COS-7 cell. The construct lacking the transmembrane region (ΔTM) [(B) and (E)] localizes primarily at the PM, where it has a diffuse distribution (as clear by the different views of the COS-7 cell and the INS-1 cell). The construct lacking the C-terminal region (ΔCTerm) [(C) and (F)] precisely colocalizes with the ER marker Sec61β. Scale bar is 2 μm. (G) Purified human TMEM24 lacking the transmembrane domain (residues 36 to 706) was incubated with liposomes containing 10% PE and either 20% PS or 5% other test lipid, with the remainder PC. Liposomes were sedimented and analyzed for associated protein. ΔTM-TMEM24 directly binds acidic membranes without specific lipid preference. PA and PI are less charged than the other phosphoinositides in the panel, and their charge, closer to the hydrophobic layer, may be more shielded by the head groups of neighboring phospholipids. (H) Purified SMP-C2 fragment of TMEM24 (residues 76 to 414) does not sediment with membranes in the presence of EDTA or calcium. Liposome compositions are as in (G).
Fig. 3
Fig. 3. TMEM24 localization at ER-PM contact sites is regulated by a phosphorylation-dephosphorylation mechanism
(A) TMEM24 localization at ER-PM contacts, as monitored by TIRF microscopy, is not lost upon PM PI(4,5)P2 depletion by blue light–induced CRY2-OCRL 5-phosphatase domain recruitment to the PM in COS-7 cells. (B) HeLa cells transfected with TMEM24-EGFP were analyzed by TIRF microscopy. In basal conditions, TMEM24 forms PM puncta corresponding to ER-PM contact sites (left). Treatment with thapsigargin induces partial dissociation of TMEM24 from the PM, as revealed by loss of fluorescence in the TIRF plane (middle). Subsequently, TMEM24 rapidly reassociated with the PM, overshooting basal fluorescence intensity (right). (C) Quantitation of (B). (D) HeLa cells overexpressing TMEM24-EGFP were preincubated with the PKC inhibitor bisindolylmaleimide II before stimulation with thapsigargin. PKC inhibition prevented TMEM24 dissociation from the PM but did not block excess TMEM24 PM accumulation during recovery. (E) In vitro phosphorylation of a cytosolic TMEM24 construct by purified PKC. 32P incorporation onto TMEM24 by PKC (autoradiogram in inset) (30 min, 37°C) followed Michaelis-Menten kinetics with a Km of 0.81 ± 0.085 μM. (F) Calcineurin/PP2B inhibition by pretreating HeLa cells over-expressing TMEM24-EGFP with cyclosporine before thapsigargin treatment inhibited PM reassociation of TMEM24. Thapsigargin-mediated dissociation from the PM was unaffected by cyclosporine, which did not impair PKC activity. (G) CaMK inhibition by KN-93 did not affect TMEM24 dissociation from the PM. Recovery of TMEM24 is partially attenuated under KN-93 treatment due to loss of downstream calcineurin/PP2B activation by CaMK.
Fig. 4
Fig. 4. TMEM24 harbors a phosphatidylinositol (PI)–binding SMP module
(A) TMEM24 (76 to 260) adopts an SMP domain fold. TMEM24 SMP domain is modeled as a dimer by analogy to the E-Syt2 SMP domains (at right). Disordered segments are represented as dashed lines. TMEM24 helix α2 and strand β13 move closer compared with the corresponding helix and strand in the liganded E-Syt2 structure. Four lipid molecules bound by E-Syt2 dimer are indicated. (B) Native electrospray ionization mass spectrometry (ESI-MS) analysis of TMEM24 SMP domain purified from Expi293 cells indicates dimerization, with masses consistent with one phospholipid molecule bound per monomer. Whereas the monomeric fraction exists in both apo and holo form, the dimeric fraction is mostly complexed with lipid. (C) SEC of purified TMEM24 SMP domain preincubated with liver PI indicates that PI binds and comigrates with TMEM24 SMP. Although TMEM24 SMP migrates as a dimer in solution, a small shift in apparent molecular weight upon binding to PI occurs, consistent with a change in conformation but not oligomerization state. (D) Analysis of individual fractions from 14.0 to 16.0 ml by SDS-PAGE confirms redistribution of the liganded SMP domain. (E) Fractions between 14.0 and 16.0 ml retention volume were pooled; lipid was extracted and resolved by thin-layer chromatography. The PI band did not appear in these fractions when TMEM24 SMP or liver PI was subjected separately to SEC.
Fig. 5
Fig. 5. TMEM24 functions as a lipid-transfer protein with a preference for PI
(A) In vitro lipid-transfer assays with TMEM24. (Top) Heavy donor (blue) and light acceptor (yellow) liposomes were mixed in the presence or absence of a recombinant N-terminally His12-tagged construct comprising the cytosolic portion of TMEM24 (residues 36 to 706). After lipid transfer (15 or 30 min),TMEM24 was degraded with protease and liposomes were separated by centrifugation. Donor and acceptor liposomes were separately analyzed for lipid content by HPLC or scintillation counting. (Bottom left) TMEM24 was tethered to donor liposomes containing PS via the basic C terminus and to acceptor liposomes containing 2 mole % (mol %) DOGS-NTA-Ni2+ via its N-terminal His12 tag. Transfer to acceptor liposomes of PS or PI, originally present at 20 mol % only in the donor liposomes, was measured by HPLC analysis after 30-min transfer. (Bottom right) TMEM24 was tethered to donor liposomes containing DOGS-NTA-Ni2+ via its N-terminal His12 tag and to acceptor liposomes containing PS via the basic C terminus. Transfer to acceptor liposomes of 14C-PE or 3H-PI, originally present only in the donor liposomes, was measured by scintillation counting after 15-min transfer. (B) Quantitation of the assays described in (A). TMEM24 preferentially transfers PI over PS (top panel) and PE (bottom panel). Mean ± SD indicated. (C) Schematic representation of light-induced TMEM24 PM recruitment strategy. TMEM24 was rapidly recruited to the PM by light-induced dimerization of CRY2 and CIBN modules. A version of TMEM24 with its C terminus replaced by a CRY2-mCherry module was expressed in COS-7 cells. The CIBN module is localized to the PM via a C-terminal CAAX box. (D) Dynamics of TMEM24-CRY2-mCherry (black) and ΔSMP-TMEM24-CRY2-mCherry (red) fluorescence before, during, and after blue-light stimulation (20 pulses, 200 ms each), as monitored by TIRF microscopy. (E) TIRF microscopy of PI(4)P marker iRFP-P4M (left) and the PI(4,5)P2 marker iRFP-PH-PLCδ (right) before, during, and after blue-light stimulation. Note the increase in both phosphoinositides due to transfer of PI to the PM by TMEM24 after blue-light stimulation (black). PM recruitment of ΔSMP-TMEM24-CRY2-mCherry does not affect PM levels of PI(4)P or PI(4,5)P2 (red). P values are P = 0.0049 and P < 0.0001 for (B) upper and lower panels, respectively, and P < 0.0001 for both (E) panels.
Fig. 6
Fig. 6. Oscillatory localization of TMEM24 at the PM affects insulin secretion in insulinoma cells
(A) (Top) High-glucose stimulation of WT INS1 cells triggers oscillations of TMEM24 (TMEM24-mCherry, top) and calcium (GcaMP6s, bottom) opposite in phase as monitored by TIRF microscopy. (Inset) Depletion of TMEM24 (peak inverted) reaches maximum after the peak of calcium influx. Dotted lines indicate corresponding peaks. (Bottom) Kymograph shows that TMEM24 and calcium oscillations are opposite in phase after glucose stimulation. (B) WT and TMEM24 KO INS1 cell lysates were resolved by SDS-PAGE and immunoblotted with antibodies against TMEM24 and insulin, showing no difference in insulin biogenesis in the KO cells. Top band in anti-insulin panel is proinsulin, whereas bottom band is insulin. GAPDH was used as a loading control. (C) Calcium oscillations (monitored by GcaMP6s) are abrogated after glucose stimulation in TMEM24 KO INS1 cells. (D) Exogenous overexpression of TMEM24-mCherry in KO cells rescues glucose-induced calcium oscillations. Dotted lines indicate corresponding peaks. (E) Quantitation of Ca2+ oscillations per minute in WT, TMEM24 KO, and TMEM24 KO INS1 cells rescued with either full-length or ΔSMP TMEM24 upon glucose stimulation. (F) Dynamics of PI(4,5)P2 recovery in WT (black) and TMEM24 KO (red) INS1 cells overexpressing PI(4,5)P2 marker iRFP-PHPLCδ after treatment with carbachol to deplete PI(4,5)P2 at the PM. TMEM24 KO cells show delayed recovery of basal PI(4,5)P2 level at the PM. This delay is rescued by exogenous overexpression of TMEM24-EGFP (dashed line). Black dots indicate time points for which significance is reported (n.s., no significant difference; *P < 0.05; **P < 0.01; ****P < 0.0001). Significances of difference for WT versus KO and KO versus KO+TMEM24 are indicated above and below traces, respectively. (G) Amount of secreted insulin from WT or TMEM24 KO INS1 cells after glucose stimulation was assayed by ELISA. Stimulated insulin secretion was normalized to secretion under basal conditions (mean ± SEM). (H) TMEM24 KO INS1 cells were transfected with full-length TMEM24-EGFP or ΔSMP-TMEM24, and insulin secretion was assayed by ELISA. Only TMEM24 containing the lipid-transfer module was able to rescue insulin secretion. (I) Anti-insulin immunofluorescence of WT (top) and TMEM24 KO (bottom) INS1 cells shows that the typical punctate distribution of insulin granules is not perturbed by loss of TMEM24 expression (as quantified at right). Scale bar is 5 μm. P values are 0.0003 for WTversus TMEM24 KO, 0.0005 for WTversus KO+ΔSMP, 0.0019 for KO versus KO+FL TMEM24, and 0.0029 for KO+FL TMEM24 versus KO+ΔSMP in (E), 0.0408 in (G), and 0.0428 for control versus FL TMEM24 and 0.0031 for FL TMEM24 versus ΔSMP in (H).
Fig. 7
Fig. 7. Model for TMEM24 modulation of pulsatile insulin secretion through effects on phosphoinositide and calcium dynamics
(Top left) In insulin-secreting cells at resting state, ER-anchored TMEM24 localizes to ER-PM contact sites via interaction between its basic C-terminal region and the PM. In this state, TMEM24 transfers PI from the ER to the PM, maintaining the pool of PM phosphoinositides, including PI(4)P and PI(4,5)P2. PI(4,5)P2 interacts with voltage-gated calcium channels, increasing their responsiveness to depolarization caused by glucose stimulation. PI(4,5)P2 also participates in priming of insulin secretory granules in preparation for exocytosis. (Right) Upon glucose stimulation or membrane depolarization, calcium influx through the calcium channels stimulates insulin release while activating the PKC pathway, causing phosphorylation of the TMEM24 C terminus. This C-terminal modification is responsible for the dispersion of TMEM24 from ER-PM contacts into the reticular ER. Transfer of PI to the PM by TMEM24 is abolished. Calcium also activates PLCδ, which is responsible for cleavage of PI(4,5)P2 to form DAG and IP3, partially depleting PI(4,5)P2 from the PM and further elevating levels of cytosolic calcium via activation of IP3 receptors in the ER membrane. The loss of PI(4,5)P2 eventually promotes the closed state of PM calcium channels and terminates IP3 production. (Bottom left) Calcium-induced activation of the S/T-phosphatase calcineurin/PP2B results in dephosphorylation of the TMEM24 C terminus, allowing TMEM24 to repopulate ER-PM contact sites. PI transfer to the PM resumes to replenish PI(4)P and PI(4,5)P2 pools, reenabling calcium channel opening and priming a new population of insulin granules. The oscillatory interplay between calcium and TMEM24 continues in a cyclical fashion for the duration of glucose stimulation.

Comment in

References

    1. Tavassoli S, et al. Plasma membrane: Endoplasmic reticulum contact sites regulate phosphatidylcholine synthesis. EMBO Rep. 2013;14:434–440. doi: 10.1038/embor.2013.36. - DOI - PMC - PubMed
    1. Holthuis JCM, Levine TP. Lipid traffic: Floppy drives and a superhighway. Nat Rev Mol Cell Biol. 2005;6:209–220. doi: 10.1038/nrm1591. - DOI - PubMed
    1. Stefan CJ, et al. Osh Proteins regulate phosphoinositide metabolism at ER-plasma membrane contact sites. Cell. 2011;144:389–401. doi: 10.1016/j.cell.2010.12.034. - DOI - PubMed
    1. Stefan CJ, Manford AG, Emr SD. ER-PM connections: Sites of information transfer and inter-organelle communication. Curr Opin Cell Biol. 2013;25:434–442. doi: 10.1016/j.ceb.2013.02.020. - DOI - PMC - PubMed
    1. Saheki Y, et al. Control of plasma membrane lipid homeostasis by the extended synaptotagmins. Nat Cell Biol. 2016;18:504–515. doi: 10.1038/ncb3339. - DOI - PMC - PubMed

Publication types