. 2017 Feb 17;355(6326):739-743.
doi: 10.1126/science.aak9973.

Treadmilling by FtsZ filaments drives peptidoglycan synthesis and bacterial cell division

Affiliations

Treadmilling by FtsZ filaments drives peptidoglycan synthesis and bacterial cell division

Alexandre W Bisson-Filho et al. Science. .

Abstract

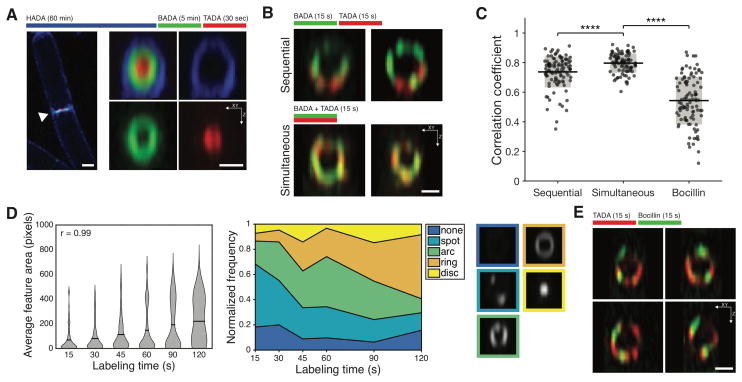
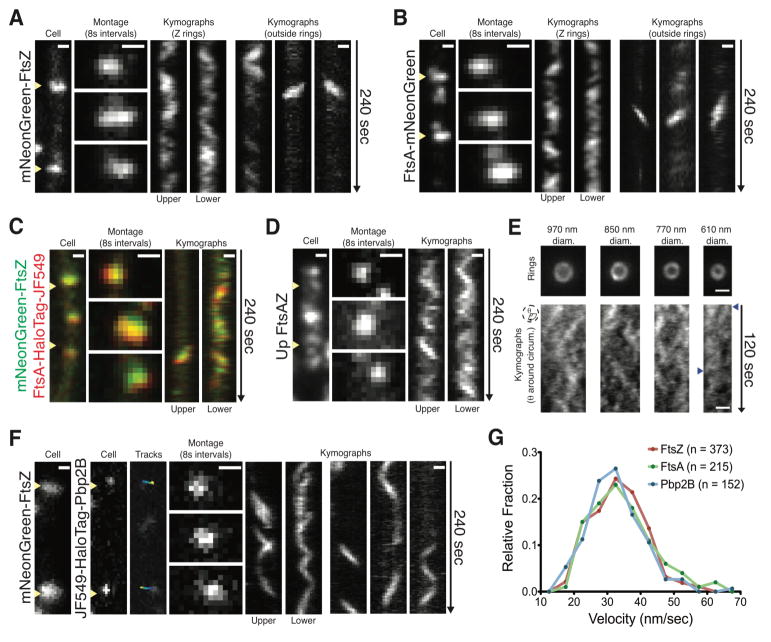
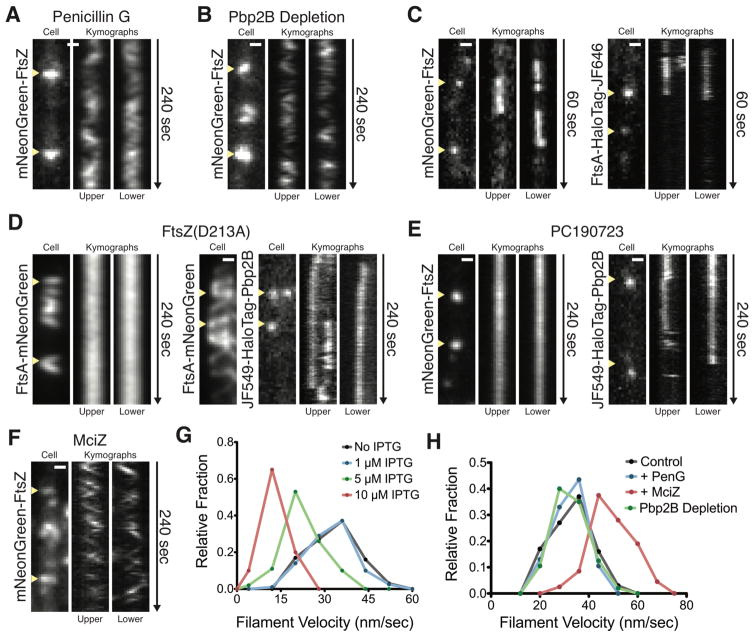
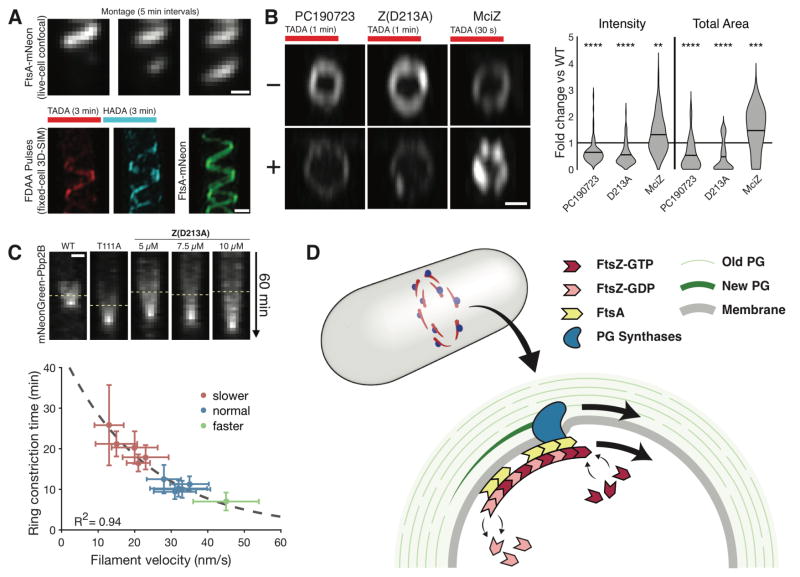
The mechanism by which bacteria divide is not well understood. Cell division is mediated by filaments of FtsZ and FtsA (FtsAZ) that recruit septal peptidoglycan-synthesizing enzymes to the division site. To understand how these components coordinate to divide cells, we visualized their movements relative to the dynamics of cell wall synthesis during cytokinesis. We found that the division septum was built at discrete sites that moved around the division plane. FtsAZ filaments treadmilled circumferentially around the division ring and drove the motions of the peptidoglycan-synthesizing enzymes. The FtsZ treadmilling rate controlled both the rate of peptidoglycan synthesis and cell division. Thus, FtsZ treadmilling guides the progressive insertion of new cell wall by building increasingly smaller concentric rings of peptidoglycan to divide the cell.


Figures

Figure 1
Figure 1. Septal PG synthesis occurs at discrete, mobile sites
A Sequential FDAA labeling of division septa shows outside-in synthesis. (Right) 90° rotations of septa. B Sites of PG synthesis move around the septum. C Correlation coefficient of overlap between colors in B and E. Line: mean, box: SD. D FDAA labeling proceeds from puncta to complete rings. (Left) Area of FDAA features increases with pulse length. Lines: mean, r: correlation coefficient of the means. (Center) Blinded classification of FDAA features at various pulse lengths. (Right) representative images of septal PG structures. E Sites of PG synthesis are offset from synthetic enzymes. Colored bars indicate time course of FDAA labeling. All images taken with 3D-SIM. Scale bars: 0.5 μm.
Figure 2
Figure 2. FtsAZ and Pbp2B move directionally around the division site
A mNeonGreen-FtsZ (bAB185) shows directional motion inside (left) and outside (right) the Z ring. B FtsA-mNeonGreen (bAB167) shows directional motion inside (left) and outside (right) the ring. C mNeonGreen-FtsZ and FtsA-HaloTag-JF549 (bAB229) colocalize and move together. D FtsAZ overexpression (100 μM IPTG in bAB221) creates increased FtsZ filaments showing directional motion outside the Z ring. E Vertically immobilized cells (SH41) show multiple, independent mNeonGreen-FtsZ filaments moving in both directions around the division site. Cropped rings and radial kymographs in early (left), mid (center), and late (right) divisional stages. Blue arrows indicate directional FtsZ tracks. F Single molecules of Pbp2B (bGS31, 15 min incubation of 50 pM JF549) move directionally around the division site. Blue to yellow indicates trajectory time. G Velocity distributions of FtsA filaments, FtsZ filaments, and single Pbp2B molecules. Kymographs drawn at yellow arrows. Scale bars = 0.5 μm
Figure 3
Figure 3. Directional FtsAZ motion is driven by treadmilling, independent of cell wall synthesis, and required for Pbp2B motion
A FtsZ continues to move directionally after treatment with Penicillin G. bAB185 imaged 5 minutes after addition of 3 μl of 10 mg/ml penicillin G to an agarose pad. B FtsZ continues to move directionally after Pbp2B depletion. Before imaging, bGS31 was grown without IPTG until no divisions were observed (3 hours). C Single molecules of FtsZ and FtsA are immobile within the division site. Single molecules were obtained by growing bAB219 with no IPTG (left) or bAB229 with 15 min of 250 pM JF646 (right). D Overexpression of GTPase-deficient FtsZ stops FtsZ and Pbp2B motion. bAB217 (left) and bGS90 (right) were imaged after induction of FtsZ(D213A) (100 μM IPTG, 1 hour). E Directional motion of FtsZ and Pbp2B is stopped by PC190723. bAB185 (left) and bGS31 with 15 min incubation of 50 pM JF549 (right) 5 minutes after addition of 10 μM PC190723. F FtsZ velocity increases following exposure to MciZ. bAB185 was imaged following addition of 1 μM MciZ in a microfluidic device. G Velocity distributions of FtsZ filaments (bAB217) at different levels of FtsZ(D213A) induction. H Velocity distributions of FtsZ filaments under different perturbations.
Figure 4
Figure 4. Cytokinesis is controlled by directional motion of FtsAZ filaments
A FtsZ(D213A) overexpression (1 mM IPTG in bAB217) produces slowly growing FtsA spirals with spiral FDAA insertion. (Top) Montage of growing FtsA spiral acquired with spinning-disk confocal. (Bottom) Sequential FDAA labeling and FtsA localization imaged with 3DSIM in a fixed cell. B Altering FtsZ velocity changes the amount and total area of FDAA incorporation. (left) PY79 with 1 μg/ml PC190723, 10 min, (middle) bAB217 with 20 μM IPTG for 1 hour, (right) AH93 with 50 mM xylose, 5 min. Following treatment, cells were incubated with TADA for time indicated, fixed, then imaged with 3D-SIM. (Far right) Total intensity and area of septal FDAA incorporation. Lines: mean. C Cytokinesis scales with FtsZ treadmilling velocity. For each condition, pairs of strains were used to measure 1) FtsZ velocity (using mNeonGreen-FtsZ) and 2) septation rates (using mNeonGreen-Pbp2B). (Top) Kymographs of constricting Pbp2B rings in different FtsZ backgrounds (line marks start of constriction). (Bottom) Plot of constriction time vs. FtsZ velocity in different conditions. Treadmilling velocity and septation rates were acquired in identical conditions, save for measurements with MciZ (see SOM). Error bars: SD of the mean. D Model for treadmilling-coupled cell division. (Top) The Z ring contains multiple FtsAZ filaments that treadmill around the division plane, pulling associated PG synthases. (Bottom) FtsZ treadmilling both regulates and distributes the activity of the PG synthases, building sequentially smaller uniform arcs of PG to divide the cell.

Comment in

Similar articles

Cited by

References

    1. Chen Y, Erickson HP. Rapid in vitro assembly dynamics and subunit turnover of FtsZ demonstrated by fluorescence resonance energy transfer. J Biol Chem. 2005;280:22549–22554. - PMC - PubMed
    1. Szwedziak P, Wang Q, Bharat TAM, Tsim M, Lowe J. Architecture of the ring formed by the tubulin homologue FtsZ in bacterial cell division. Elife. 2014;3:e04601. - PMC - PubMed
    1. Ma X, Ehrhardt DW, Margolin W. Colocalization of cell division proteins FtsZ and FtsA to cytoskeletal structures in living Escherichia coli cells by using green fluorescent protein. Proc Natl Acad Sci USA. 1996;93:12998–13003. - PMC - PubMed
    1. Gamba P, Veening JW, Saunders NJ, Hamoen LW, Daniel RA. Two-step assembly dynamics of the Bacillus subtilis divisome. J Bacteriol. 2009;191:4186–4194. - PMC - PubMed
    1. Kuru E, et al. In Situ probing of newly synthesized peptidoglycan in live bacteria with fluorescent D-amino acids. Angew Chem Int Ed Engl. 2012;51:12519–12523. - PMC - PubMed

Publication types

MeSH terms