. 2017 Feb 17;355(6326):744-747.
doi: 10.1126/science.aak9995.

GTPase activity-coupled treadmilling of the bacterial tubulin FtsZ organizes septal cell wall synthesis

Affiliations

GTPase activity-coupled treadmilling of the bacterial tubulin FtsZ organizes septal cell wall synthesis

Xinxing Yang et al. Science. .

Abstract

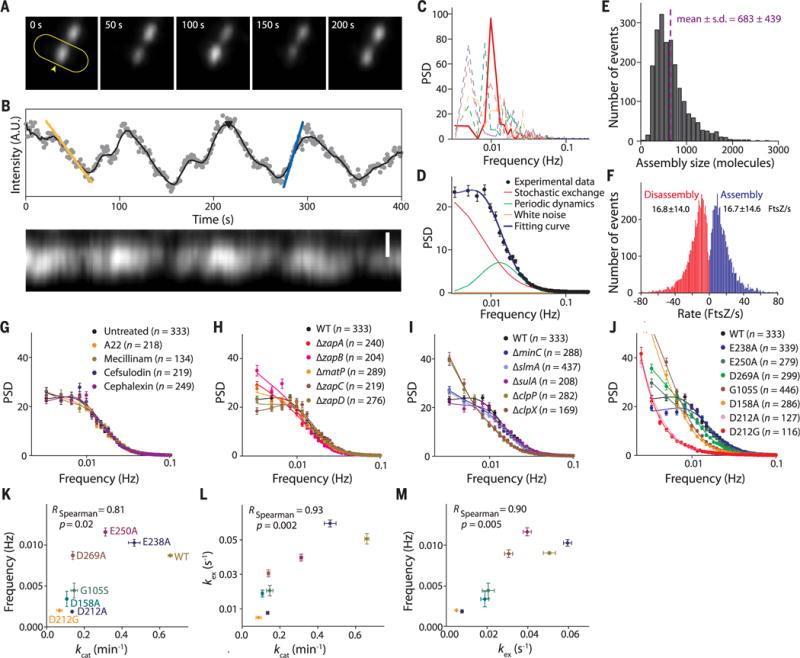
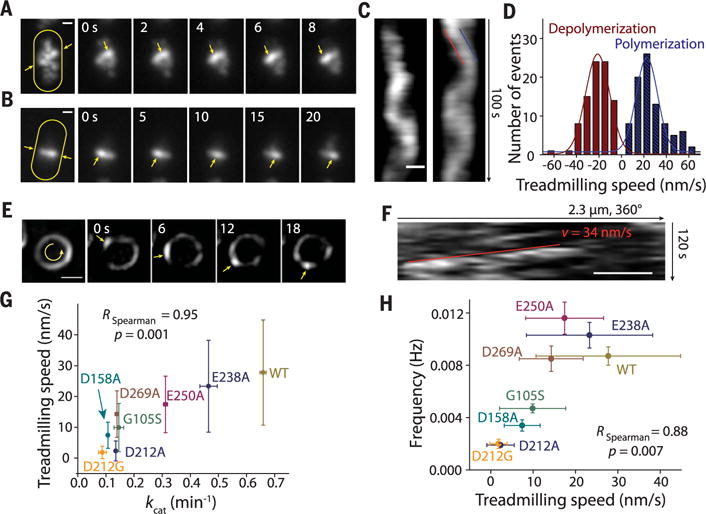
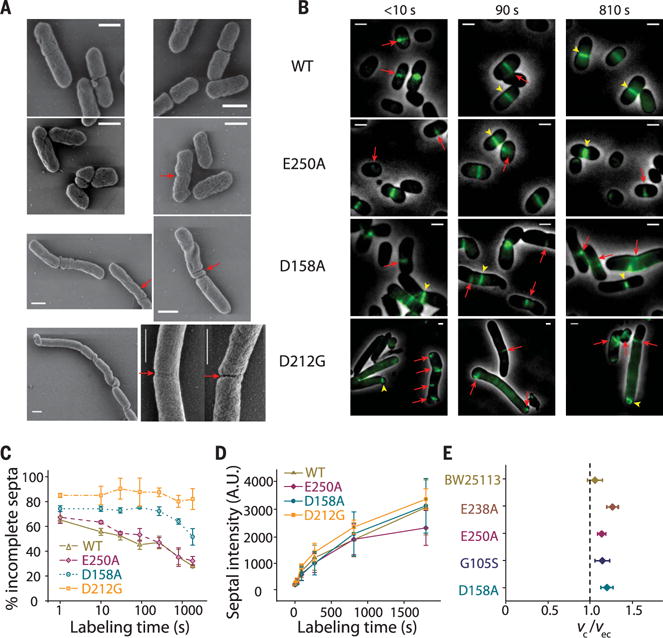
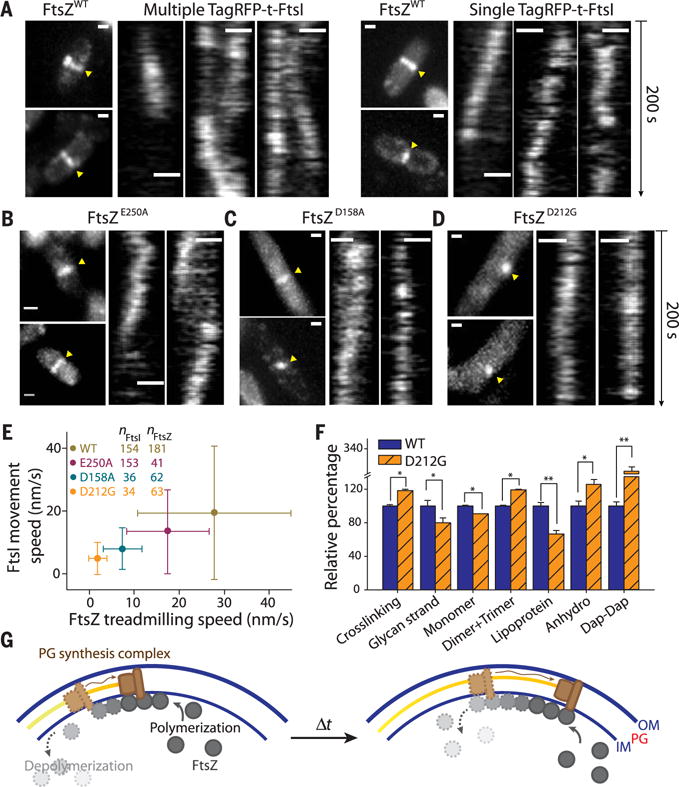
The bacterial tubulin FtsZ is the central component of the cell division machinery, coordinating an ensemble of proteins involved in septal cell wall synthesis to ensure successful constriction. How cells achieve this coordination is unknown. We found that in Escherichia coli cells, FtsZ exhibits dynamic treadmilling predominantly determined by its guanosine triphosphatase activity. The treadmilling dynamics direct the processive movement of the septal cell wall synthesis machinery but do not limit the rate of septal synthesis. In FtsZ mutants with severely reduced treadmilling, the spatial distribution of septal synthesis and the molecular composition and ultrastructure of the septal cell wall were substantially altered. Thus, FtsZ treadmilling provides a mechanism for achieving uniform septal cell wall synthesis to enable correct polar morphology.


Figures

Fig. 1
Fig. 1. FtsZ exhibits periodic dynamics coupled to GTPase activity
(A) Montages of live E. coli cells showing periodic FtsZ-GFP (arrowhead) intensity fluctuations. (B) Integrated fluorescence time trace and kymograph of the cell outlined in (A) (1 frame/s; movie S1). The black curve is the moving average (every 20 points) of the raw intensity (gray dots).The assembly and disassembly rates were determined as the maximal slopes along each rise (blue line) and decay (yellow line), respectively. Assembly size was estimated from intensity peaks (black arrowhead) (12). Scale bars, 0.5 μm. (C) Representative power spectral density (PSD) curves for individual cells (dashed lines), with the one from (B) highlighted in solid red. (D) The mean PSD over all cells (± SEM; n = 333 cells), fitted with a model (blue curve) that takes into account stochastic subunit exchange between the Z-ring and the cytoplasmic pool (red curve) and the periodic fluctuations (green curve) (12). (E) FtsZ assembly size distribution with 683 ± 439 FtsZ and FtsZ-GFP molecules (n = 2039 fluorescence peaks). (F) Distributions of assembly and disassembly rates. (G to J) Average PSD curves in drug-treated cells (G), in cells lacking Z-ring stabilizers (H) or regulators (I), and in cells expressing FtsZ GTPase mutants (J). In (G), cells were treated with A22 (inhibitor of MreB), mecillinam (inhibitor of the elongation-specific transpeptidase PBP2), cefsulodin (inhibitor of division-specific glycosyltransferase and transpeptidase PBP1b), and cephalexin (inhibitor of the division-specific transpeptidase FtsI) at concentrations above their minimum inhibitory concentration. Error bars denote SEM. (K) The GTPase catalytic turnover rate kcat is correlated with Z-ring periodic frequency. E238A, Glu238 → Ala; D269A, Asp269 → Ala; G105S, Gly105 → Ser. (L) kcat is correlated with the stochastic exchange rate kex. (M) kex is correlated with Z-ring periodic frequency. Error bars denote SD.
Fig. 2
Fig. 2. FtsZ polymers exhibit treadmilling dynamics in live E. coli cells
(A and B) Maximum intensity projection (left panels) and montages from time-lapse imaging (movies S8 and S9) of a cell in which a midcell Z-ring was not assembled (A) and a cell with a clearly visible midcell Z-ring (B). (C) Kymographs of the cells in (A) and (B) computed from the intensity along the line between the two yellow arrows. (D) Distributions of polymerization and depolymerization speeds as measured from the leading and trailing edges of individual cells’ kymographs [blue and red lines in (C)]. (E) Structured illumination microscopy maximum-intensity projection (left panel) and montage from time-lapse imaging of counterclockwise Z-ring treadmilling. (F) Kymograph of fluorescence along circumference of cell in (E). (G and H) Treadmilling speeds correlated with kcat (G) and Z-ring dynamics (H). Error bars denote SD. Scale bars, 0.5 μm.
Fig. 3
Fig. 3. FtsZ GTPase mutants change the spatial distribution pattern but not the rate of septal PG synthesis
(A) Representative scanning electron microscopy images of FtsZ wild-type, E250A, D158A, and D212G cells. Red arrows denote deformed, asymmetric septa. (B) Representative images of HADA-labeled septa for short (<10 s), intermediate (90 s), and long (810 s) labeling pulses. Red arrows and yellow arrowheads denote incomplete and complete septa, respectively. (C) Severe GTPase mutants had large percentages of cells with incompletely labeled septa even for long pulses. (D) Integrated septal HADA fluorescence increased similarly with labeling pulse duration in all strains. (E) The ratio of septum closure rate (vc) to elongation rate during constriction (vec) was similar among tested GTPase mutants. Error bars denote SEM. Scale bars, 1 μm.
Fig. 4
Fig. 4. Altered directional movement of FtsI and septal PG composition in FtsZmut cells
(A) Directional movement of multiple (left) or single (right) TagRFP-t-FtsI molecules along the septum in FtsZcells. Images with yellow arrowheads are maximum intensity projections; kymograph images are from positions denoted by the arrowheads. (B to D) Examples of TagRFP-t-FtsI directional movement in E250A (B), D158A (C), and D212G (D) cells. (E) Mean TagRFP-t-FtsI movement speed is highly correlated with FtsZ treadmilling speed; error bars denote SD (see table S1). (F) UPLC analysis reveals altered PG composition in FtsZD212G cells. The relative percentage of each component of D212G was normalized to that of wild-type cells. Error bars denote SD, n = 3; *P < 0.05, **P < 0.01 (unpaired t test). (G) A schematic model depicting FtsZ treadmilling (gray circles) that drives directional movement (wavy arrows) of the septal PG synthesis machinery (brown rectangles), leading to processive synthesis of new septal PG (yellow). IM and OM, inner and outer membranes; scale bars, 0.5 μm.

Comment in

References

    1. Nogales E, Downing KH, Amos LA, Löwe J. Nat Struct Biol. 1998;5:451–458. - PubMed
    1. Vaughan S, Wickstead B, Gull K, Addinall SG. J Mol Evol. 2004;58:19–29. - PubMed
    1. Bi EF, Lutkenhaus J. Nature. 1991;354:161–164. - PubMed
    1. Egan AJ, Vollmer W. Ann NY Acad Sci. 2013;1277:8–28. - PubMed
    1. de Boer P, Crossley R, Rothfield L. Nature. 1992;359:254–256. - PubMed

Publication types

MeSH terms