. 2017 Feb 2:11:38.
doi: 10.3389/fnins.2017.00038. eCollection 2017.

Promoter-Specific Expression and Genomic Structure of IgLON Family Genes in Mouse

Affiliations

Promoter-Specific Expression and Genomic Structure of IgLON Family Genes in Mouse

Taavi Vanaveski et al. Front Neurosci. .

Abstract

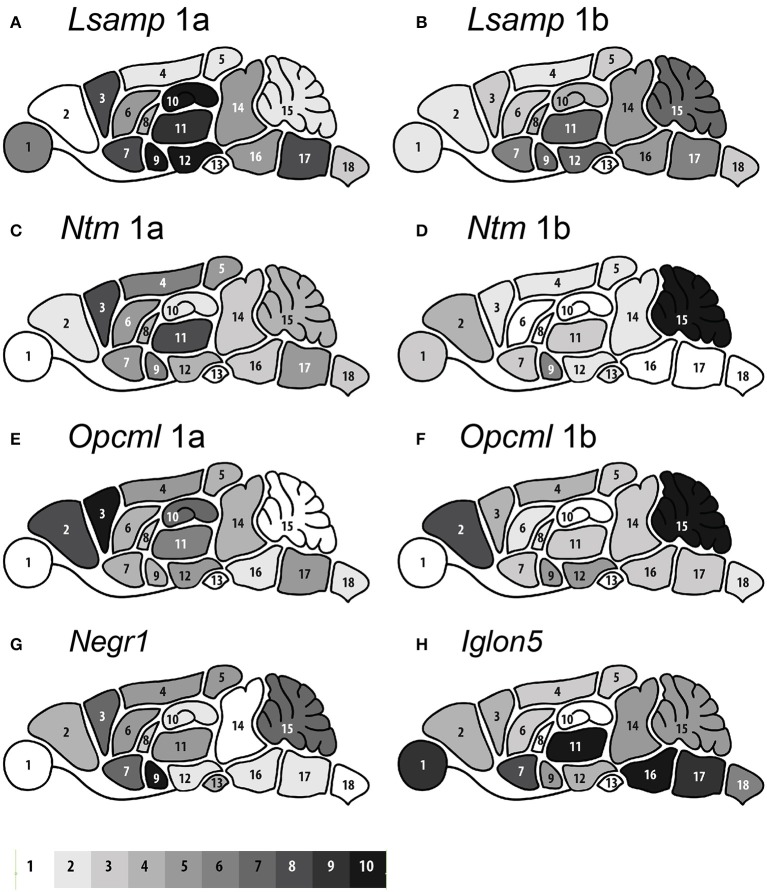
IgLON family is composed of five genes: Lsamp, Ntm, Opcml, Negr1, and Iglon5; encoding for five highly homologous neural adhesion proteins that regulate neurite outgrowth and synapse formation. In the current study we performed in silico analysis revealing that Ntm and Opcml display similar genomic structure as previously reported for Lsamp, characterized by two alternative promotors 1a and 1b. Negr1 and Iglon5 transcripts have uniform 5' region, suggesting single promoter. Iglon5, the recently characterized family member, shares high level of conservation and structural qualities characteristic to IgLON family such as N-terminal signal peptide, three Ig domains, and GPI anchor binding site. By using custom 5'-isoform-specific TaqMan gene-expression assay, we demonstrated heterogeneous expression of IgLON transcripts in different areas of mouse brain and several-fold lower expression in selected tissues outside central nervous system. As an example, the expression of IgLON transcripts in urogenital and reproductive system is in line with repeated reports of urogenital tumors accompanied by mutations in IgLON genes. Considering the high levels of intra-family homology shared by IgLONs, we investigated potential compensatory effects at the level of IgLON isoforms in the brains of mice deficient of one or two family members. We found that the lack of IgLONs is not compensated by a systematic quantitative increase of the other family members. On the contrary, the expression of Ntm 1a transcript and NEGR1 protein was significantly reduced in the frontal cortex of Lsamp-deficient mice suggesting that the expression patterns within IgLON family are balanced coherently. The actions of individual IgLONs, however, can be antagonistic as demonstrated by differential expression of Syp in deletion mutants of IgLONs. In conclusion, we show that the genomic twin-promoter structure has impact on both anatomical distribution and intra-family interactions of IgLON family members. Remarkable variety in the activity levels of 1a and 1b promoters both in the brain and in other tissues, suggests complex functional regulation of IgLONs by alternative signal peptides driven by 1a and 1b promoters.

Keywords: IgLON; IgLON5; KILON; LSAMP; NEGR1; NTM; OPCML; alternative promoters.


Figures

Figure 1
Figure 1
Twin promoter structure of Opcml, Ntm, and Lsamp genes and alignment of alternative 5′ fragments of the coding region. (A) Genomic structure and assembly of the 5′ part of 1a and 1b promoter derived transcripts. The core of the schema has been adapted from Pimenta and Levitt (2004). The 5′ part of 1b transcript is assembled by adding up 1b' + 1b” + exon 2, followed by the downstream exons in both rodent and human. The 5′ part of 1a transcript is typically assembled by adding up 1a + 1b” + exon 2, followed by the downstream exons. Exception of this is Lsamp 1a transcript in rodents where one extra exon (1a') is included: 1a +1a' +1b” + exon 2. Horizontal arrows denoted as 1aF and 1bF indicate transcript specific forward primers on 1a and 1b first exon respectively. Horizontal arrow denoted as uniR indicates universal reverse primer on exon 2 and # denoted as uniP indicates custom probe on 1b”. *Ntm and Opcml are located in the same chromosome locus. (B) Alignment of unique 1a and 1b transcript specific 5′ sequences of Ntm and Opcml in rodent and human with corresponding Refseq or Non-Refseq accession numbers. NA refers to “accession number not available,” indicating rat 1a sequences that were missing from the NCBI/Ensembl.org database at the time of the analysis and were therefore amplified and analyzed for the current study. More information about accession numbers can be found in Supplementary Tables S1–S3.
Figure 2
Figure 2
Alignment of first and second exon specific amino acid sequences encoded by 8 known IgLON transcripts in mouse. 1a or first part of exon 1b (1b') is separated by vertical dashed line from universally added exon 1b”. Underlined sequence indicates extra exon 1a' of Lsamp 1a transcript. First exons 1a (1a') or 1b' code for signal peptides. 1b” is separated by second dashed line from universally added exon 2. Exons 1b” and 2 code for first immunoglobulin domain indicated by box. # Indicates two conserved cysteine residues in the first Ig domain.
Figure 3
Figure 3
The brain-wide expression distribution of eight IgLON transcripts based on relative expression intensity measured by qPCR. (A) Lsamp 1a, (B) Lsamp 1b, (C) Ntm 1a, (D) Ntm 1b, (E) Opcml 1a, (F) Opcml 1b, (G) Negr1, and (H) IgLon5. The numbers on the mouse brain image (1–18) represent regions: eye (1), olfactory bulb (2), frontal cortex (3), parietal cortex (4), occipital cortex (5), temporal cortex including amygdaloid complex (9), caudate putamen (6), ventral striatum (7), septum pellucidum (8), hippocampus (10), thalamus (11), hypothalamus (12), pituitary gland (13), midbrain including colliculi (14), cerebellum (15), pons (16), medulla oblongata (17), and spinal cord (18). The 10-level gray-scale shades from white to black represent minimum (1–10%) to maximum (90–100%) expression levels respectively. The range of 10 intervals was achieved by dividing the difference of 2−ΔCT minimum to maximum values separately for each gene. The exact 2−ΔCT values (±SEM) for all qPCR data in the brain and non-neural tissues have been presented in Supplementary Table S10.
Figure 4
Figure 4
The average mRNA expression level of IgLON transcripts in Wt, Lsamp−/−, Ntm−/−, and Lsamp−/−/Ntm−/− mutant mice measured by qPCR. Expression levels are presented for (A) frontal cortex (FRO) and (B) hippocampus (HIP) based on promoter activity at the age of 4–5 months as 2−ΔCT ± SEM. For Opcml 1a/1b, Ntm 1a/1b, Lsamp 1a/1b and Negr1 the left Y-axis applies and for Iglon5 (separated in the Figure by a vertical dashed line from the other transcripts) the right Y-axis applies. n = 6 in all groups; *p < 0.05; **p < 0.01; ***p < 0.001. One-way ANOVA was used for every isoform in parallel in two mutant subgroups: Group I: Wt (wild-type), Lsamp−/−, Lsamp−/−/Ntm−/−, and Group II: Wt, Ntm−/−, Lsamp−/−/Ntm−/−. Intra-group differences were further emphasized by Tukey's HSD test. Two mutant groups Lsamp−/−and Ntm−/− were further compared by Student's t-test at significance level of α = 0.05. In the frontal cortex, the expression level of Ntm 1a was lower in Lsamp−/− animals compared to Wt. The expression level of Opcml 1a and Negr1 was lower in Lsamp−/− animals compared to Ntm−/−. However, in the hippocampus, the level of Iglon5 was significantly higher in Lsamp−/− animals compared to both Wt and Lsamp−/−/Ntm−/− groups. More detailed information about statistical findings can be found in the Sections Gene Expression Alterations in Frontal Cortex and Gene Expression Alterations in Hippocampus.
Figure 5
Figure 5
The individual protein expression levels of NTM and NEGR1 in the frontal cortex of wild-type and Lsamp−/− mice measured by western blot. (A) NTM and (B) NEGR1 expression levels are presented relative to GAPDH; n = 7; *p < 0.05. It is important to note that NTM antibody is not able to discriminate between 1a and 1b isoforms, therefore the significant decrease of Ntm 1a in Lsamp−/− animals (Figure 4A) is only detectable in mRNA level.
Figure 6
Figure 6
The average mRNA expression level of Syp transcript in Wt, Lsamp−/−, Ntm−/−, and Lsamp−/−/Ntm−/− mutant mice measured by qPCR. Expression levels are presented for frontal cortex (FRO) and hippocampus (HIP) based on promoter activity as 2−ΔCT ± SEM. n = 6 in all groups; *p < 0.05; ***p < 0.001. One-way ANOVA was used for every isoform in parallel in two mutant subgroups: Group I: Wt (wild-type), Lsamp−/−, Lsamp−/−/Ntm−/−, and Group II: Wt, Ntm−/−, Lsamp−/−/Ntm−/−. Intra-group differences were further emphasized by Tukey's HSD test. Two mutant groups Lsamp−/−and Ntm−/− were further compared by Student's t-test at significance level of α = 0.05. Statistically significant differences in Syp expression were observed only in the hippocampus where the level was higher in Ntm−/− animals than in Wt, Lsamp−/−/Ntm−/−, and Lsamp−/− animals. More detailed information about statistical findings about Syp expression can be found in the Section Gene Expression Alterations in Hippocampus.

Similar articles

Cited by

References

    1. Akeel M., McNamee C. J., Youssef S., Moss D. (2011). DIgLONs inhibit initiation of neurite outgrowth from forebrain neurons via an IgLON-containing receptor complex. Brain Res. 1374, 27–35. 10.1016/j.brainres.2010.12.028 - DOI - PubMed
    1. Altschul S. F., Gish W., Miller W., Myers E. W., Lipman D. J. (1990). Basic local alignment search tool. J. Mol. Biol. 215, 403–410. 10.1016/S0022-2836(05)80360-2 - DOI - PubMed
    1. Barøy T., Kresse S. H., Skårn M., Stabell M., Castro R., Lauvrak S., et al. . (2014). Reexpression of LSAMP inhibits tumor growth in a preclinical osteosarcoma model. Mol. Cancer 13:93. 10.1186/1476-4598-13-93 - DOI - PMC - PubMed
    1. Bedner P., Steinhäuser C., Theis M. (2012). Functional redundancy and compensation among members of gap junction protein families? Biochim. Biophys. Acta 1818, 1971–1984. 10.1016/j.bbamem.2011.10.016 - DOI - PubMed
    1. Behan A. T., Byrne C., Dunn M. J., Cagney G., Cotter D. R. (2009). Proteomic analysis of membrane micro domain-associated proteins in the dorsolateral prefrontal cortex in schizophrenia and bipolar disorder reveals alterations in LAMP, STXBP1 and BASP1 protein expression. Mol. Psychiatry 14, 601–613. 10.1038/mp.2008.7 - DOI - PubMed

LinkOut - more resources