

PCR Inhibition of a Quantitative PCR for Detection of Mycobacterium avium Subspecies Paratuberculosis DNA in Feces: Diagnostic Implications and Potential Solutions
- PMID: 28210245
- PMCID: PMC5288348
- DOI: 10.3389/fmicb.2017.00115
PCR Inhibition of a Quantitative PCR for Detection of Mycobacterium avium Subspecies Paratuberculosis DNA in Feces: Diagnostic Implications and Potential Solutions
Abstract
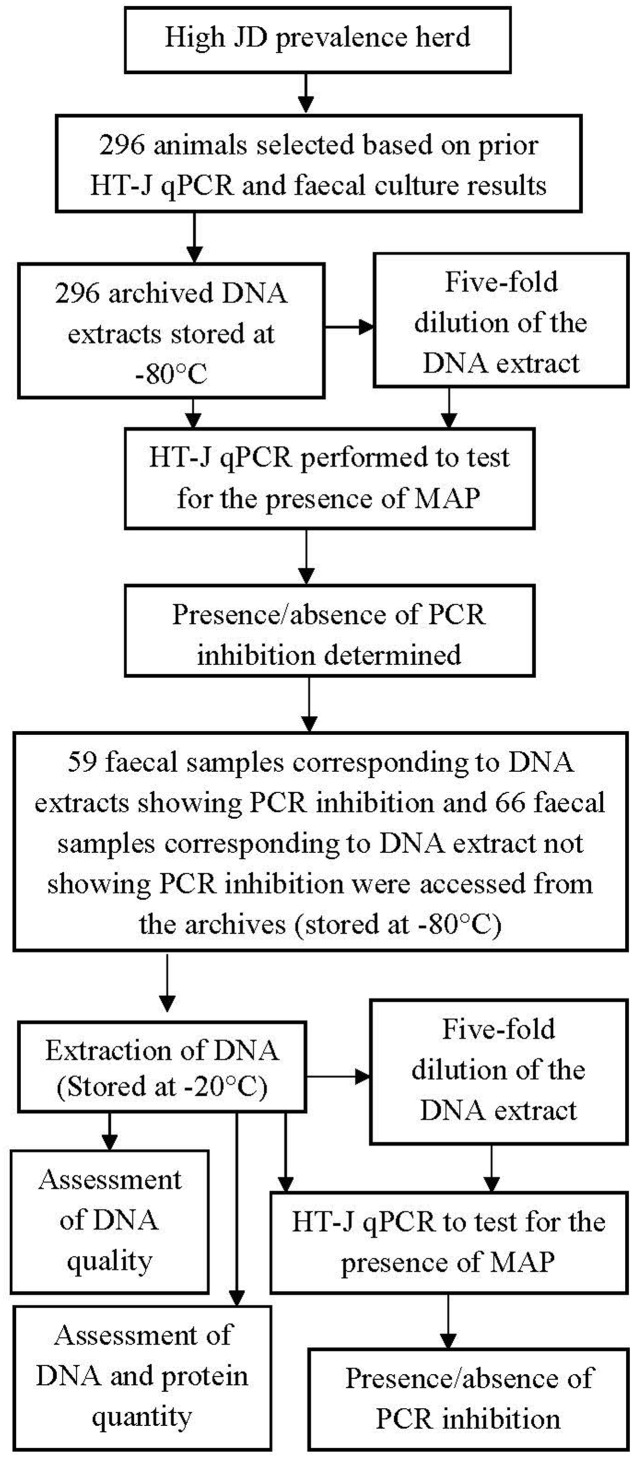
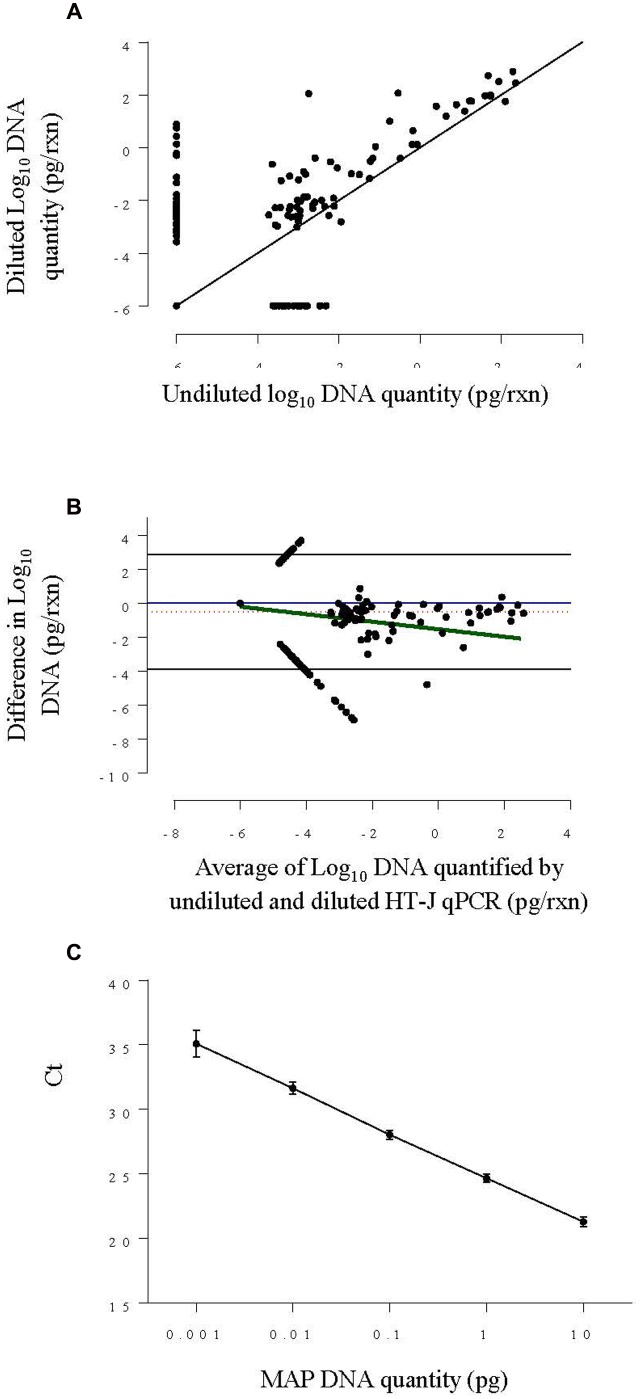
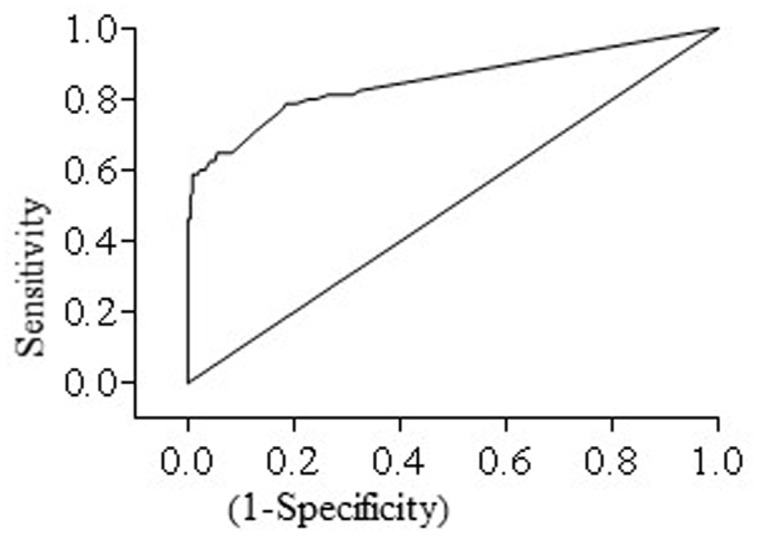
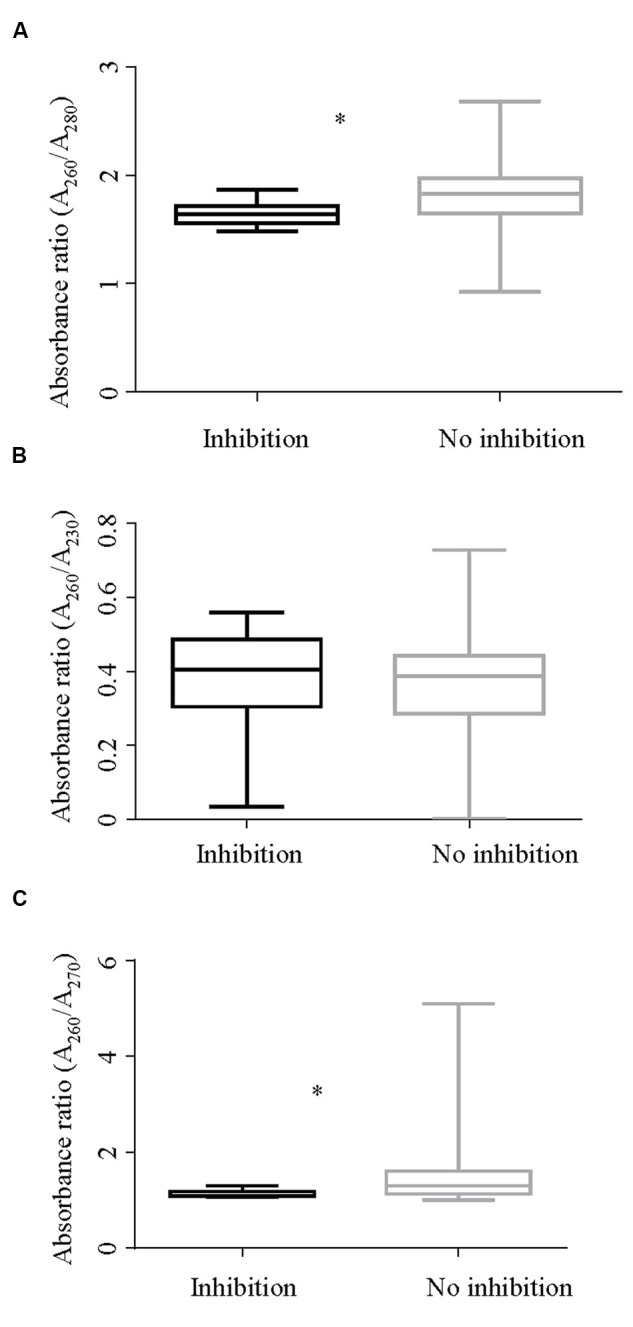
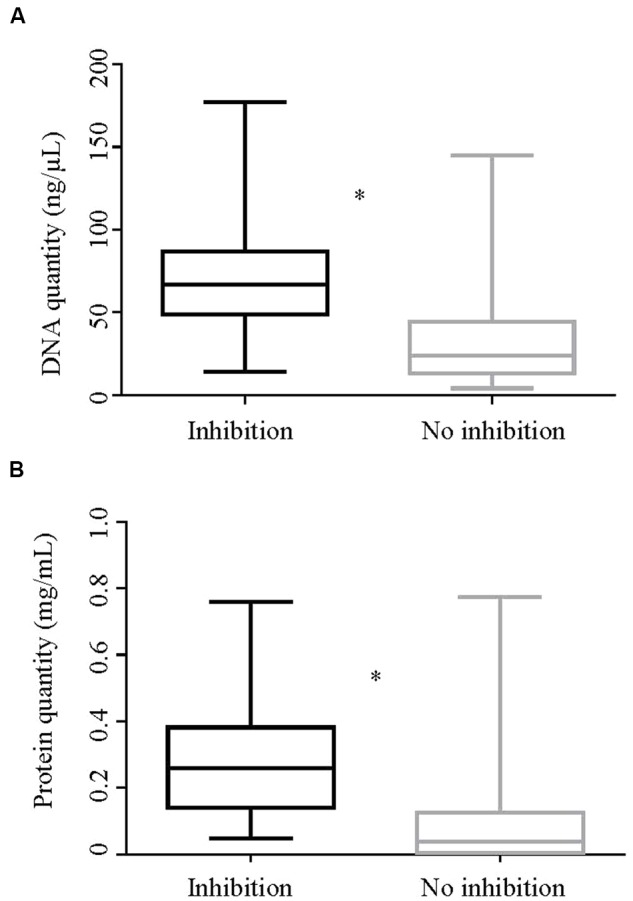
Molecular tests such as polymerase chain reaction (PCR) are increasingly being applied for the diagnosis of Johne's disease, a chronic intestinal infection of ruminants caused by Mycobacterium avium subspecies paratuberculosis (MAP). Feces, as the primary test sample, presents challenges in terms of effective DNA isolation, with potential for PCR inhibition and ultimately for reduced analytical and diagnostic sensitivity. However, limited evidence is available regarding the magnitude and diagnostic implications of PCR inhibition for the detection of MAP in feces. This study aimed to investigate the presence and diagnostic implications of PCR inhibition in a quantitative PCR assay for MAP (High-throughput Johne's test) to investigate the characteristics of samples prone to inhibition and to identify measures that can be taken to overcome this. In a study of fecal samples derived from a high prevalence, endemically infected cattle herd, 19.94% of fecal DNA extracts showed some evidence of inhibition. Relief of inhibition by a five-fold dilution of the DNA extract led to an average increase in quantification of DNA by 3.3-fold that consequently increased test sensitivity of the qPCR from 55 to 80% compared to fecal culture. DNA extracts with higher DNA and protein content had 19.33 and 10.94 times higher odds of showing inhibition, respectively. The results suggest that the current test protocol is sensitive for herd level diagnosis of Johne's disease but that test sensitivity and individual level diagnosis could be enhanced by relief of PCR inhibition, achieved by five-fold dilution of the DNA extract. Furthermore, qualitative and quantitative parameters derived from absorbance measures of DNA extracts could be useful for prediction of inhibitory fecal samples.
Keywords: Johne’s disease (JD) diagnosis; Mycobacterium paratuberculosis; PCR inhibition; fecal PCR; qPCR diagnosis; relief PCR inhibition.
Figures
References
-
- Allen W. M., Berrett S., Patterson D. S. P. (1974a). A biochemical study of experimental Johne’s disease: I. Plasma protein leakage into the intestine of sheep. J. Comp. Pathol. 84 381—384. - PubMed
-
- Allen W. M., Berrett S., Patterson D. S. P. (1974b). A biochemical study of experimental Johne’s disease: II. An in vitro study of L-histidine uptake by sheep intestinal mucosa. J. Comp. Pathol. 84 385–389. - PubMed
-
- Allen W. M., Patterson D. S. P., Slater T. F. (1974c). A biochemical study of experimental Johne’s disease: III. Protein metabolism in sheep and mice. J. Comp. Pathol. 84 391–398. - PubMed
LinkOut - more resources
Full Text Sources
Other Literature Sources