

Kinetics of Cytotoxic Lymphocytes Reconstitution after Induction Chemotherapy in Elderly AML Patients Reveals Progressive Recovery of Normal Phenotypic and Functional Features in NK Cells
- PMID: 28210257
- PMCID: PMC5288405
- DOI: 10.3389/fimmu.2017.00064
Kinetics of Cytotoxic Lymphocytes Reconstitution after Induction Chemotherapy in Elderly AML Patients Reveals Progressive Recovery of Normal Phenotypic and Functional Features in NK Cells
Abstract
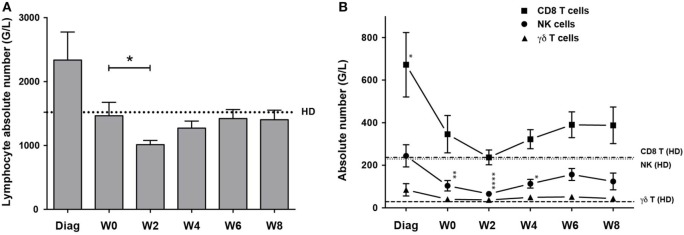
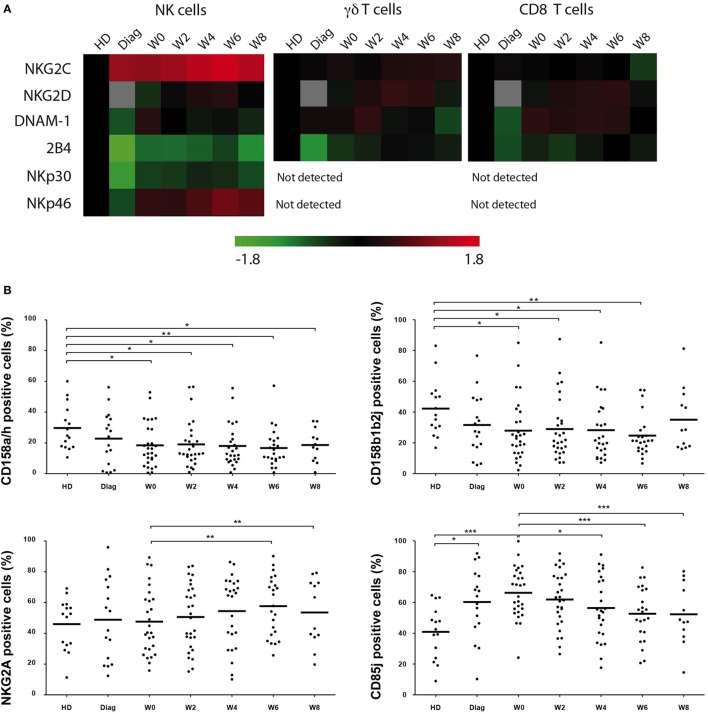
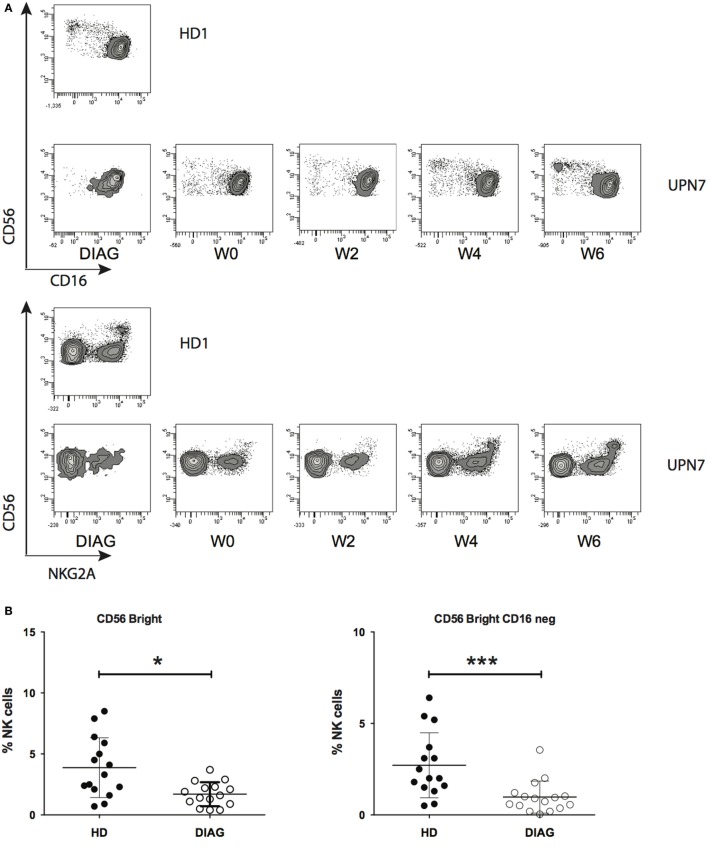
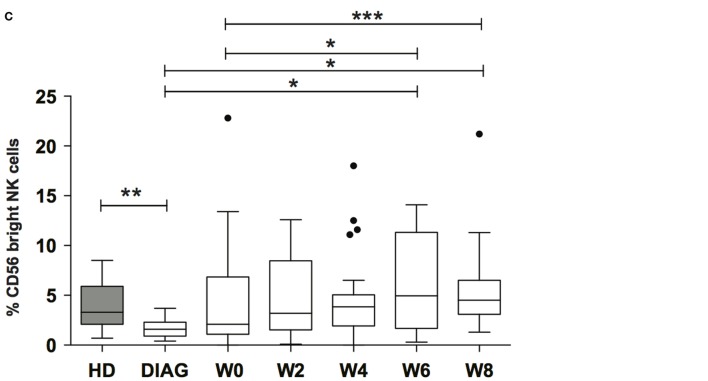
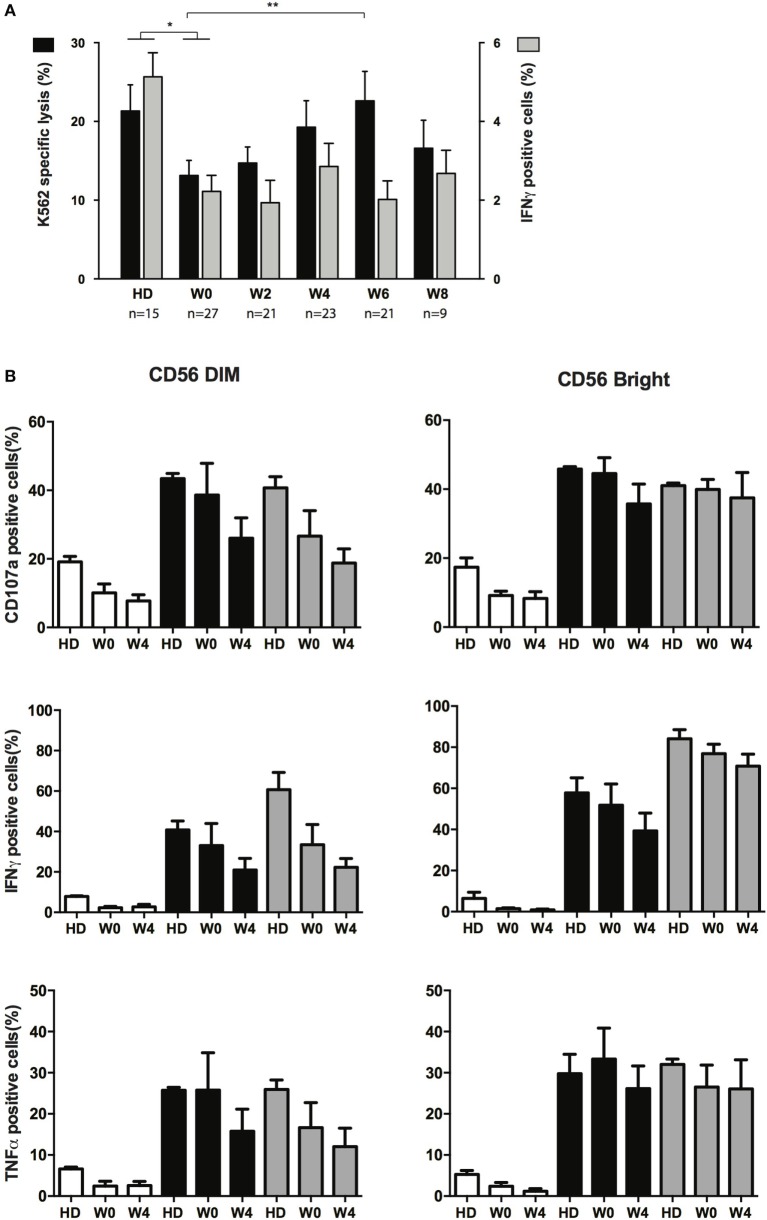
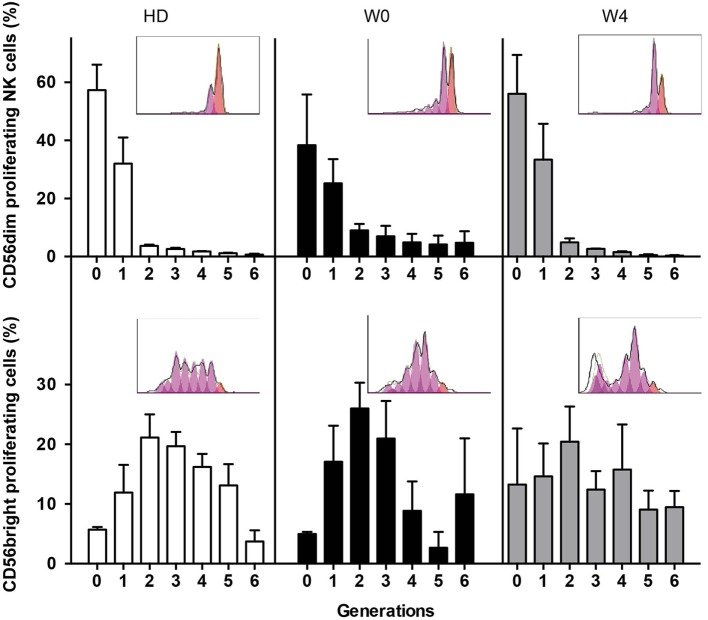
NK cells are defective in acute myeloid leukemia (AML) at diagnosis. Here, we studied the kinetic of expression of the major activating and inhibitory receptors of NK, CD8 T, and γδ T cells in patients undergoing chemotherapy (CT) for the treatment of AML (n = 29). We showed that NK cells are the main affected population at diagnosis and that expression of activating receptors is partially restored within a few weeks after CT. CD8 T cells and γδ T cells are only weakly affected at diagnosis. Killer cell immunoglobulin-like receptor expression by NK cells, but not NKG2A and CD85j, was downregulated. Interestingly, the development of NK cells appeared altered as the most immature CD56bright NK cells were seriously underrepresented. Finally, we showed that NK cell functions were only partially restored 6 weeks after CT as degranulation capabilities of NK cells recovered, whereas cytokine production remained low. Our data point out NK cells as antitumor effectors peculiarly hampered by leukemic cells. This study may indicate a timeline when NK-mediated therapies or other immunotherapies could be performed, particularly for patients excluded of hematopoietic stem cell transplantation.
Keywords: NK cells; NK functions; activating receptors; acute myeloid leukemia; chemotherapy.
Figures
Similar articles
-
NK cell maturation to CD56(dim) subset associated with high levels of NCRs overrides the inhibitory effect of NKG2A and recovers impaired NK cell cytolytic potential after allogeneic hematopoietic stem cell transplantation.Leuk Res. 2016 Apr;43:58-65. doi: 10.1016/j.leukres.2015.12.002. Epub 2015 Dec 17. Leuk Res. 2016. PMID: 26856773 Clinical Trial.
-
Regulation of Adaptive NK Cells and CD8 T Cells by HLA-C Correlates with Allogeneic Hematopoietic Cell Transplantation and with Cytomegalovirus Reactivation.J Immunol. 2015 Nov 1;195(9):4524-36. doi: 10.4049/jimmunol.1401990. Epub 2015 Sep 28. J Immunol. 2015. PMID: 26416275 Free PMC article.
-
Underground Adaptation to a Hostile Environment: Acute Myeloid Leukemia vs. Natural Killer Cells.Front Immunol. 2016 Mar 9;7:94. doi: 10.3389/fimmu.2016.00094. eCollection 2016. Front Immunol. 2016. PMID: 27014273 Free PMC article. Review.
-
Activated natural killer cells from patients with acute myeloid leukemia are cytotoxic against autologous leukemic blasts in NOD/SCID mice.Leukemia. 2005 Dec;19(12):2215-22. doi: 10.1038/sj.leu.2403985. Leukemia. 2005. PMID: 16224486
-
Alloreactive Natural Killer Cells for the Treatment of Acute Myeloid Leukemia: From Stem Cell Transplantation to Adoptive Immunotherapy.Front Immunol. 2015 Oct 15;6:479. doi: 10.3389/fimmu.2015.00479. eCollection 2015. Front Immunol. 2015. PMID: 26528283 Free PMC article. Review.
Cited by
-
Microenvironmental Features Driving Immune Evasion in Myelodysplastic Syndromes and Acute Myeloid Leukemia.Diseases. 2022 Jun 10;10(2):33. doi: 10.3390/diseases10020033. Diseases. 2022. PMID: 35735633 Free PMC article. Review.
-
A key to engineering natural killer cells to attack acute myeloid leukemia.Haematologica. 2024 Apr 1;109(4):1032-1034. doi: 10.3324/haematol.2023.284272. Haematologica. 2024. PMID: 37916393 Free PMC article. No abstract available.
-
Checkpoint Inhibitors in Acute Myeloid Leukemia.Biomedicines. 2023 Jun 15;11(6):1724. doi: 10.3390/biomedicines11061724. Biomedicines. 2023. PMID: 37371818 Free PMC article. Review.
-
Low frequency of Vγ9Vδ2 T cells predicts poor survival in newly diagnosed acute myeloid leukemia.Blood Adv. 2024 Aug 27;8(16):4262-4275. doi: 10.1182/bloodadvances.2023011594. Blood Adv. 2024. PMID: 38788176 Free PMC article.
-
The Dichotomous Role of Bone Marrow Derived Cells in the Chemotherapy-Treated Tumor Microenvironment.J Clin Med. 2020 Dec 2;9(12):3912. doi: 10.3390/jcm9123912. J Clin Med. 2020. PMID: 33276524 Free PMC article. Review.
References
-
- Pical-Izard C, Crocchiolo R, Granjeaud S, Kochbati E, Just-Landi S, Chabannon C, et al. Reconstitution of natural killer cells in HLA-matched HSCT after reduced-intensity conditioning: impact on clinical outcome. Biol Blood Marrow Transplant (2015) 21:429–39.10.1016/j.bbmt.2014.11.681 - DOI - PubMed
LinkOut - more resources
Full Text Sources
Other Literature Sources
Research Materials