. 2015 May 6;1(4):433-449.e1.
doi: 10.1016/j.jcmgh.2015.04.005. eCollection 2015 Jul.

Granulocyte Macrophage Colony-Stimulating Factor-Activated CD39+/CD73+ Murine Monocytes Modulate Intestinal Inflammation via Induction of Regulatory T Cells

Affiliations

Granulocyte Macrophage Colony-Stimulating Factor-Activated CD39+/CD73+ Murine Monocytes Modulate Intestinal Inflammation via Induction of Regulatory T Cells

Toni Weinhage et al. Cell Mol Gastroenterol Hepatol. .

Abstract

Background & aims: Granulocyte macrophage colony-stimulating factor (GM-CSF) treatment induces clinical response in patients with active Crohn's disease. To explore whether monocytes mediate GM-CSF effects in vivo, we used a mouse model of chronic colitis induced by dextran sulfate sodium (DSS).

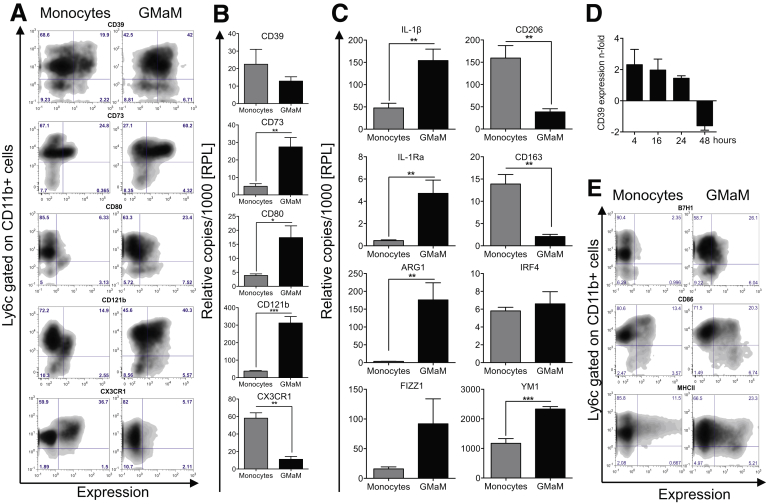
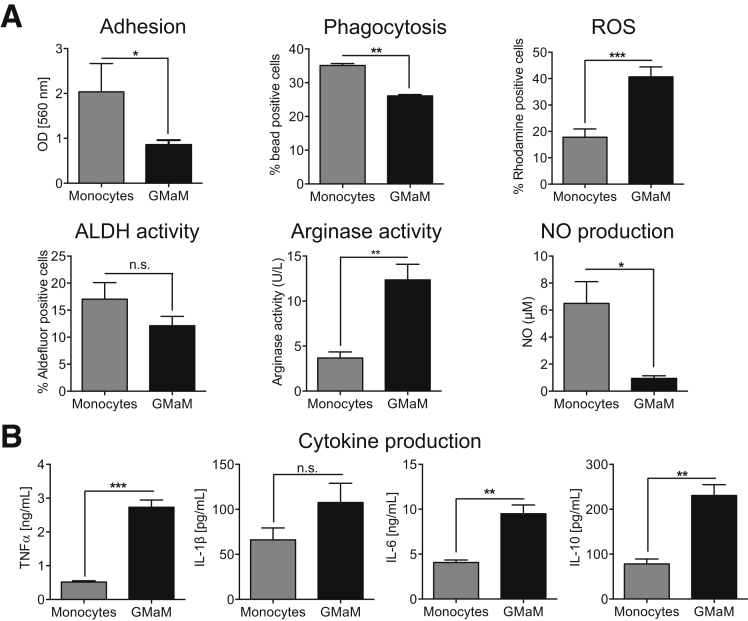
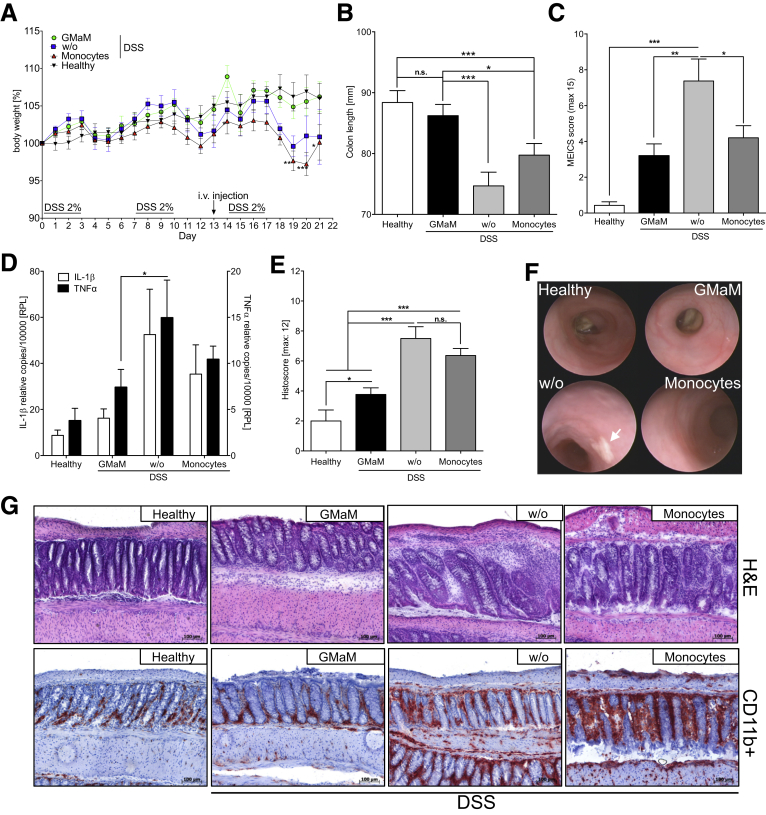
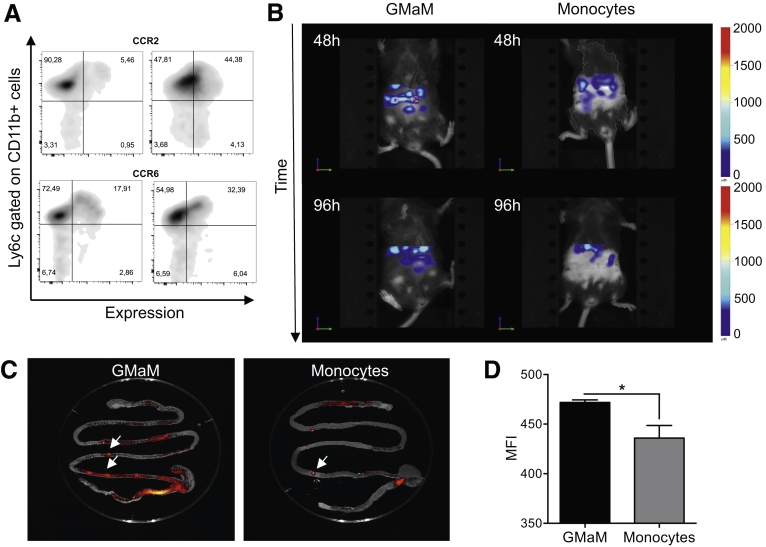
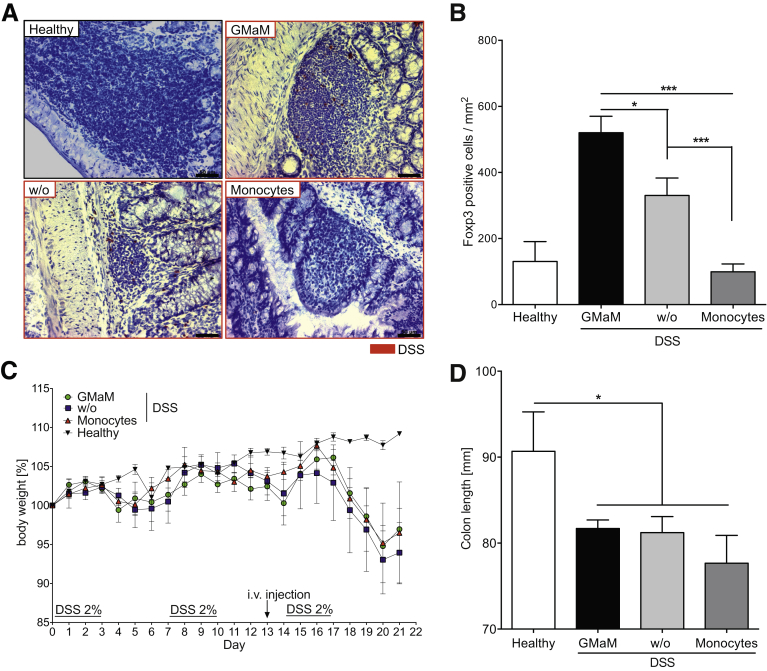
Methods: Murine bone marrow-derived monocytes were activated with GM-CSF in vitro, and gene expression, phenotype, and function of GM-CSF-activated monocytes (GMaM) were analyzed. Therapeutic effects of GMaM were assessed in a model of chronic colitis induced by repeated cycles of DSS. Monocytes were administered intravenously and their immunomodulatory functions were evaluated in vivo by clinical monitoring, histology, endoscopy, immunohistochemistry, and expression of inflammatory markers in the colon. The distribution of injected monocytes in the intestine was measured by in vivo imaging.

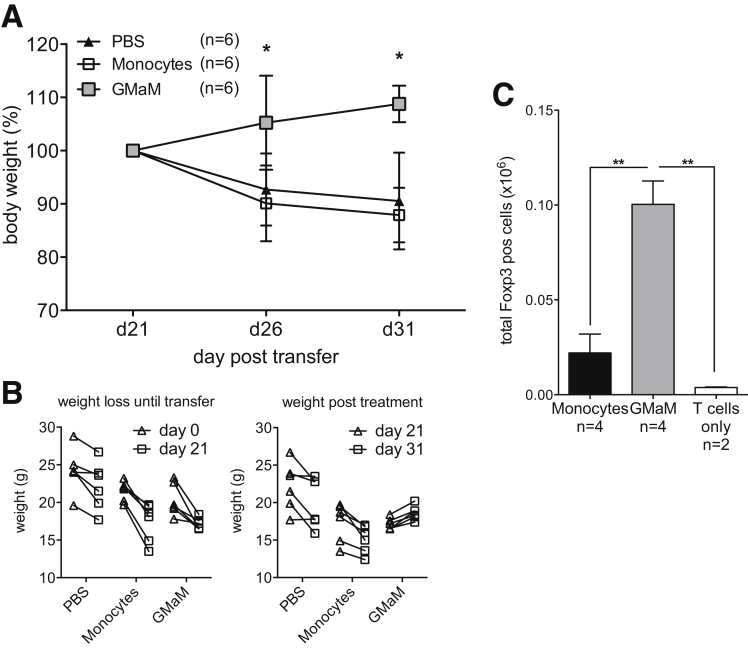
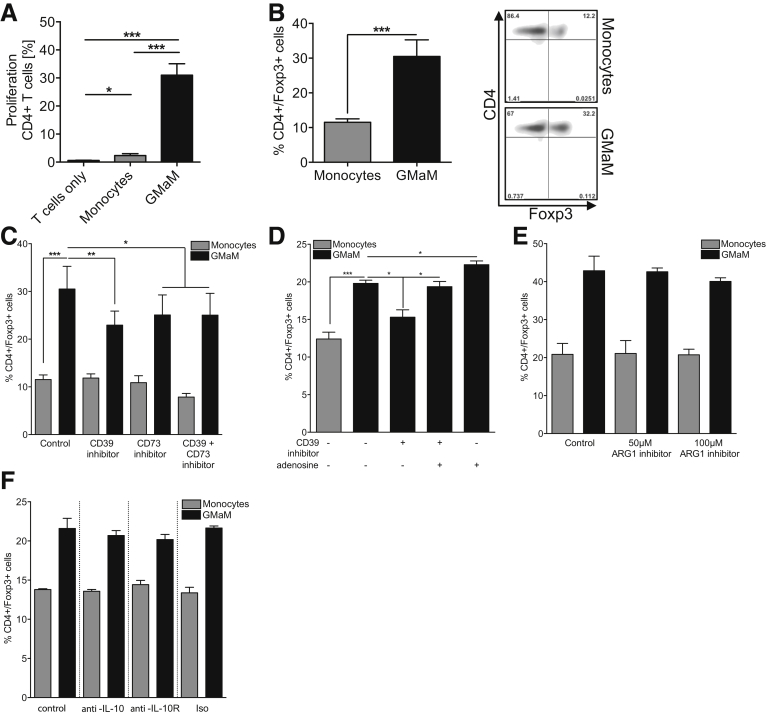
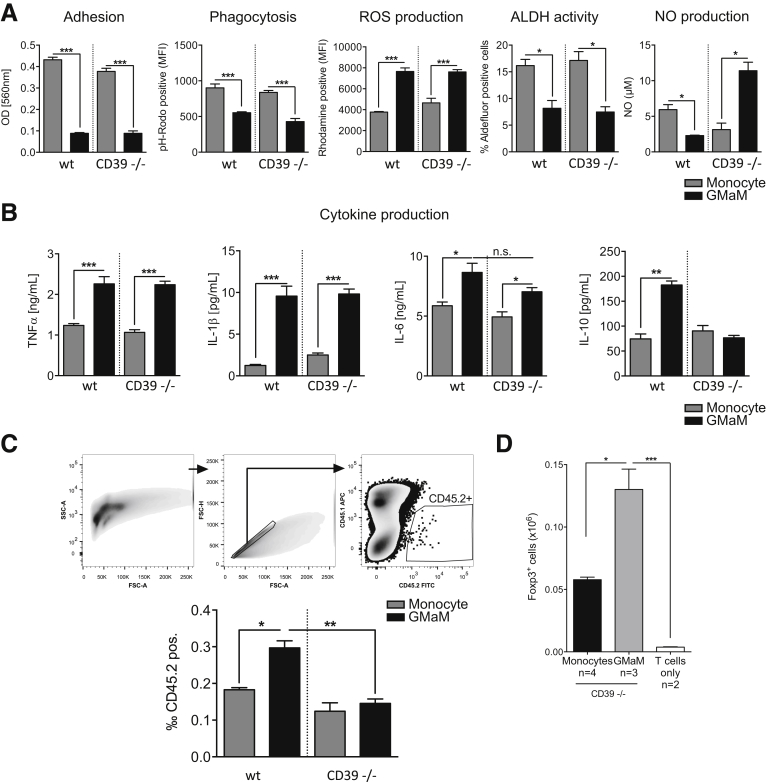
Results: GMaM expressed significantly higher levels of anti-inflammatory molecules. Production of reactive oxygen species was also increased while phagocytosis and adherence were decreased. GMaM up-regulated CD39 and CD73, which allows the conversion of adenosine triphosphate into adenosine and coincided with the induction of Foxp3+ (forkhead-box-protein P3 positive) regulatory T cells (Treg) in cocultures of GMaM and naive T cells. In chronic DSS-induced colitis, adoptive transfer of GMaM led to significant clinical improvement, as demonstrated by reduced weight loss, inflammatory infiltration, ulceration, and colon shrinkage. As GMaM migrated faster and persisted longer in the inflamed intestine compared with control monocytes, their presence induced Treg generation in vivo.

Conclusions: GM-CSF leads to specific monocyte activation that modulates experimental colitis via mechanisms that include the induction of Treg. We demonstrate a possible mechanism of Treg induction through CD39 and CD73 expression on monocytes.

Keywords: ALDH, aldehyde dehydrogenase; ATP, adenosine triphosphate; Adaptive Immunity; Arg1, arginase 1; CD, Crohn’s disease; CD39, E-NTPDase; CD73, ecto-5′-nucleotidase; CFSE, carboxyfluorescein succinimidyl ester; DC, dendritic cells; DSS, dextran sulfate sodium; Dextran Sulfate Sodium; Experimental Colitis; FCS, fetal calf serum; Foxp3, forkhead-box-protein P3; GM-CSF; GM-CSF, granulocyte macrophage colony-stimulating factor; GMaM, granulocyte-macrophage colony-stimulating factor–activated monocytes; IBD, inflammatory bowel disease; IL, interleukin; IL-1Ra, IL-1 receptor antagonist; Immune Response; Innate Immunity; LPS, lipopolysaccharide; MACS, magnetic-activated cell sorting; MEICS, murine endoscopic index of colitis severity; Monocyte; NO, nitric oxide; OD, optical density; PBS, phosphate-buffered saline; PCR, polymerase chain reaction; RA, retinoic acid; ROS, reactive oxygen species; T Cell; TNFα, tumor necrosis factor α; Treg, regulatory T cells; WT, wild type; qRT-PCR, quantitative reverse-transcription polymerase chain reaction.


Figures

Figure 1
Figure 1
Granulocyte macrophage colony-stimulating factor (GM-CSF)-activated monocytes have a distinct phenotype. Bone marrow-derived control monocytes and GM-CSF-activated monocytes (GMaM) were generated in vitro for 48 hours. (A) Resulting cells were stained for cell-surface molecules and analyzed by flow cytometry. Expression is shown as representative dot plots gated on CD11b+ cells, showing Ly6c expression (y axis) versus respective cell surface molecules (x axis). (B) Expression of cell surface molecules was validated using quantitative reverse-transcription polymerase chain reaction (qRT-PCR) (n = 5–6). (C) The mRNA levels of several monocyte subset defining molecules were investigated by qRT-PCR (n = 5–6). (D) Time-dependent expression of CD39 mRNA in GMaM using qRT-PCR shown as n-fold expression compared with control monocytes (n = 3). (E) Representative dot plots of costimulatory molecules gated on CD11b+ cells show Ly6c expression (y axis) versus respective cell surface molecules (x axis). (B–D) Graphs show mean values (± standard error of the mean), and statistical significance was determined by unpaired Student t test. *P < .05; **P < .01; ***P < .001.
Figure 2
Figure 2
Granulocyte macrophage colony-stimulating factor (GM-CSF) treatment modulates monocyte functions. (A) Upper left/middle panel: Potential of granulocyte-macrophage colony-stimulating factor–activated monocytes (GMaM) and control monocytes to adhere to plastic surfaces and phagocytosis of latex beads (n = 5). Upper right panel: Reactive oxygen species (ROS) production of GMaM and control monocytes as rhodamine positive cells (n = 11). Lower left panel: To indirectly estimate the production of retinoic acid (RA), aldehyde dehydrogenase (ALDH) activity measured using Aldefluor and displayed as the percentage of Aldefluor-positive cells (n = 4). Lower middle panel: Nitrite oxide (NO) production in cell culture supernatants of GMaM compared with control monocytes (n = 3). Lower right panel: Arginase activity evaluated by measuring the conversion of arginine to ornithine and detectable urea in cell lysates (n = 3). (B) Cytokine secretion of GMaM and control monocytes after lipopolysaccharide treatment measured in cell culture supernatants (n = 3). Statistical significance was determined by unpaired Student t test. *P < .05; **P < .01; ***P < .001; n.s., not statistically significant.
Figure 3
Figure 3
Granulocyte-macrophage colony-stimulating factor–activated monocytes (GMaM) have a therapeutic effect in dextran sulfate sodium (DSS)-induced colitis in wild-type C57Bl/6 mice. (A) Chronic colitis induced by repeated oral administration of DSS in C57Bl/6 mice. One day before the start of the third treatment cycle, mice received either control monocytes, GMaM, or phosphate-buffered saline as vehicle. Body weight was monitored daily and is shown as the percentage of weight change of three independent experiments with C57Bl/6 mice (n = 7–15 per treatment group). (B) On day 21, colons were removed, and the colon lengths were measured for each treatment group. Graphs show the mean ± standard error of the mean (SEM). (C) Murine endoscopic index of colitis severity (MEICS) scores (mean ± SEM) based on high-resolution colonoscopy. (D) Proinflammatory cytokines (interleukin 1β = white bars, tumor necrosis factor α = black bars) were measured in DSS-treated and healthy control C57Bl/6 mice by quantitative reverse-transcription polymerase chain reaction in distal colon biopsies taken at the end of the experiment. Mean ± SEM for three independent experiments (n = 11 per treatment group). (E) Colon inflammation scores (mean ± SEM) were graded by two blinded investigators and performed for the proximal and the distal part of the colon separately (n = 11). (F) Representative pictures of chronic colitis in C57Bl/6 mice on day 20 for two independent experiments are shown (arrow shows fibrin plaque; n = 11 per treatment group). (G) Representative microscopic colon images of mice with colitis and healthy control mice are shown (H&E and CD11b staining; scale bar: 100 μm). Statistical significance was determined by unpaired Student t test except for body weight change where two-way analysis of variance with Bonferroni correction was used. *P < .05; **P < .01; ***P < .001.
Figure 4
Figure 4
Granulocyte-macrophage colony-stimulating factor–activated monocytes (GMaM) infiltrate the intestine at higher numbers and persist longer. (A) GMaM and control monocytes were stained for cell surface expression of gut homing molecules and analyzed by flow cytometry. Expression is shown as representative dot plots gated on CD11b+ cells showing Ly6c expression (y axis) versus respective cell surface molecules (x axis). (B) GMaM and control monocytes were labeled with 1,1-dioctadecyl-3,3,3,3-tetramethylindotricarbocyanine iodide and injected intravenously at day 13 of chronic dextran sulfate sodium–induced colitis. Monocyte infiltration in the intestine was visualized after 48 hours and 96 hours, and representative pictures are shown (n = 3). (C) After 96 hours, the intestine was removed and monocyte infiltration especially into Peyer’s patches, visualized by fluorescence reflectance imaging, was evaluated (arrow shows Peyer’s patches). (D) Mean fluorescence intensity (mean ± SEM) of Peyer’s patches is shown (n = 5–7). Statistical significance was determined by unpaired Student t-test. *P < .05.
Figure 5
Figure 5
Granulocyte-macrophage colony-stimulating factor–activated monocytes (GMaM) induce Foxp3+T cells in dextran sulfate sodium (DSS)-induced colitis, and T cells mediate the beneficial effect of GMaM. (A) Regulatory T cells (Treg) were stained in wild-type (WT) mice treated with DSS (red frames) and control WT mice using a monoclonal antibody raised against Foxp3. Examples of colonic lymph follicles harboring Treg are shown for each treatment group (scale bar: 50 μm). (B) The number of Foxp3+ cells in lymph follicles was quantified and is displayed as mean ± standard error of the mean (SEM) of positive cells per mm2 (n = 8–12). (C) Chronic colitis was induced by repeated oral administration of DSS in Rag1−/− mice. Untreated Rag1−/− mice that received only plain water served as controls. One day before the start of the third treatment cycle, mice received control monocytes, GMaM, or as a vehicle control phosphate-buffered saline alone, intravenously by the tail vein. Body weight of Rag1−/− mice was monitored and is shown as the percentage of weight change of two independent experiments (n = 6 per treatment group). (D) Colons were removed, and the colon lengths were measured for each treatment group. Graphs show the mean ± SEM. Statistical significance was determined by unpaired student’s t-test. *P < .05; ***P < .001.
Figure 6
Figure 6
Granulocyte-macrophage colony-stimulating factor–activated monocytes (GMaM) showed beneficial effects in T-cell transfer colitis and led to increasing numbers of splenic regulatory T cells (Treg) in vivo. (A) T-cell transfer colitis was induced by intravenous injection of T cells in Rag1−/− mice. Monocyte transfer (intravenous) was performed when mice had developed colitis symptoms between days 19 and 22. Body weight was monitored and is shown as the percentage of weight change (mean ± standard error of the mean [SEM]) of two independent experiments with Rag1−/− mice (n = 6 per treatment group). (B) Weight of individual Rag1−/− mice of different groups was measured before (days 0 to 21) and after (days 21 to 31) monocyte transfer. (C) Rag1−/− mice were simultaneously injected with CD4+ T cells and GMaM or control monocytes. After 7 days, the spleens were removed, and the presence of Foxp3+ CD4+ T cells was evaluated by flow cytometry. Shown is the mean ± SEM of total Treg cells based on the number of splenocytes. Statistical significance was determined by (A) two-way or (C) one-way analysis of variance with Bonferroni correction. *P < .05; **P < .01.
Figure 7
Figure 7
Coculture of Granulocyte-macrophage colony-stimulating factor–activated monocytes (GMaM) with naive T cells led to proliferation and induction of Foxp3+CD4+T cells via adenosine/CD39 but not by arginase. (A) Naive carboxyfluorescein succinimidyl ester (CFSE)-labeled T cells were cocultured with respective monocytes (ratio 5:1, triplicates for each condition) or left alone as control. Cocultures were incubated for 5 days without further T-cell stimulation. Proliferation was evaluated as a decrease in CFSE fluorescence and quantified by analyzing the percentage of proliferating CD4+ T cells (n = 5). (B) T cells were cocultured with GMaM or control monocytes at a ratio of 5:1 (T cells/monocytes). Cells were stained for CD4 and Foxp3 expression and analyzed by flow cytometry. Dot plots (right panel) are representative for graph (left panel) that includes mean (± standard error of the mean) of five independent experiments. (C) To inhibit the function of CD39 and/or CD73, either CD39 inhibitor and/or CD73 inhibitor were added to the cocultures, respectively (n = 6). (D) To further evaluate the role of adenosine in regulatory T-cell induction, we added 10 μM adenosine to some cocultures (n = 4). (E) Arginase activity during cocultures was blocked using 50 μM or 100 μM ARG1 inhibitor (n = 4). (F) To inhibit the function of interleukin 10 (IL-10), either anti-IL-10 or anti-IL-10 receptor antibodies were used. (C–F) Cells were stained for CD4 and Foxp3 expression, and the percentages of double-positive T cells are shown. Statistical significance was determined by one-way analysis of variance with Bonferroni correction. *P < .05; **P < .01; ***P < .001.
Figure 8
Figure 8
Functional characterization of CD39-deficient granulocyte-macrophage colony-stimulating factor–activated monocytes (GMaM) in vitro and their migration in vivo. Bone marrow-derived control monocytes and GMaM were generated from CD39−/− and corresponding wild-type (WT) mice in vitro. (A) The influence of CD39 on GMaM functions was evaluated. The ability to adhere to plastic surfaces and phagocytosis of pHrodo particles is shown (n = 3). Reactive oxygen species (ROS) production is presented as mean fluorescent intensities of rhodamine positive cells (n = 3). To indirectly measure the production of retinoic acid (RA), aldehyde dehydrogenase (ALDH) activity was measured using Aldefluor and displayed as the percentage of Aldefluor-positive cells (n = 3). Nitric oxide (NO) production was determined in cell culture supernatants (n = 3). (B) Cytokine secretion after lipopolysaccharide (LPS) treatment was measured in cell culture supernatants using a bead-based multiplex assay (n = 6). (C) Chronic colitis was induced using DSS in CD45.1 mice. One day before starting the third dextran sulfate sodium (DSS) treatment cycle, the mice received CD45.2 control monocytes, GMaM, CD39−/− control monocytes, or CD39−/− GMaM (2 × 106/mouse). Two days after injection, lamina propria mononuclear cells from the colon were isolated, and infiltrating CD45.2 positive cells were stained and measured by flow cytometry. Shown is the gating strategy and respective bar graph (mean ± standard error of the mean [SEM]; n = 3–4). (D) Rag1−/− mice were simultaneously injected with naive WT CD4+ T cells (2 × 106/mouse) and CD39−/− GMaM or CD39−/− control monocytes (2 × 106/mouse). Spleens were removed after 7 days, and the presence of Foxp3+ CD4+ T cells was evaluated by flow cytometry. Shown is the mean ± SEM of total regulatory T-cells based on the number of total splenocytes. Statistical significance was determined by one-way analysis of variance with Bonferroni correction. *P < .05; **P < .01; ***P < .001; n.s., not significant.

Similar articles

Cited by

References

    1. Di Sabatino A., Biancheri P., Rovedatti L. New pathogenic paradigms in inflammatory bowel disease. Inflamm Bowel Dis. 2012;18:368–371. - PubMed
    1. Dabritz J. Granulocyte macrophage colony-stimulating factor and the intestinal innate immune cell homeostasis in Crohn’s disease. Am J Physiol Gastrointest Liver Physiol. 2014;306:G455–G465. - PubMed
    1. Glocker E., Grimbacher B. Inflammatory bowel disease: is it a primary immunodeficiency? Cell Mol Life Sci. 2012;69:41–48. - PMC - PubMed
    1. Kaser A., Zeissig S., Blumberg R.S. Inflammatory bowel disease. Annu Rev Immunol. 2010;28:573–621. - PMC - PubMed
    1. Smith A.M., Rahman F.Z., Hayee B. Disordered macrophage cytokine secretion underlies impaired acute inflammation and bacterial clearance in Crohn’s disease. J Exp Med. 2009;206:1883–1897. - PMC - PubMed