. 2017 Apr;15(2):199-213.
doi: 10.1007/s12021-017-9324-2.

Multi-View Ensemble Classification of Brain Connectivity Images for Neurodegeneration Type Discrimination

Affiliations

Multi-View Ensemble Classification of Brain Connectivity Images for Neurodegeneration Type Discrimination

Michele Fratello et al. Neuroinformatics. 2017 Apr.

Abstract

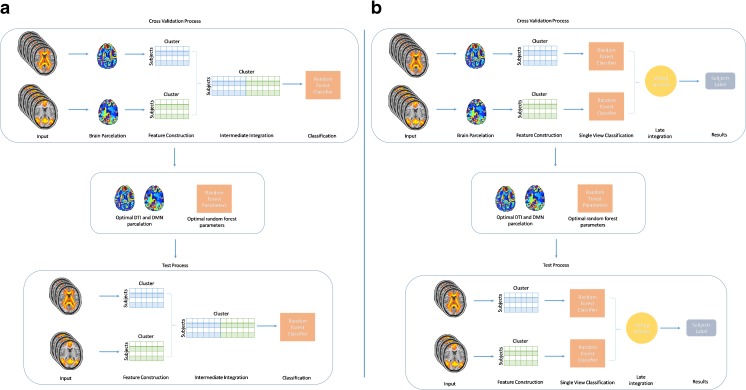
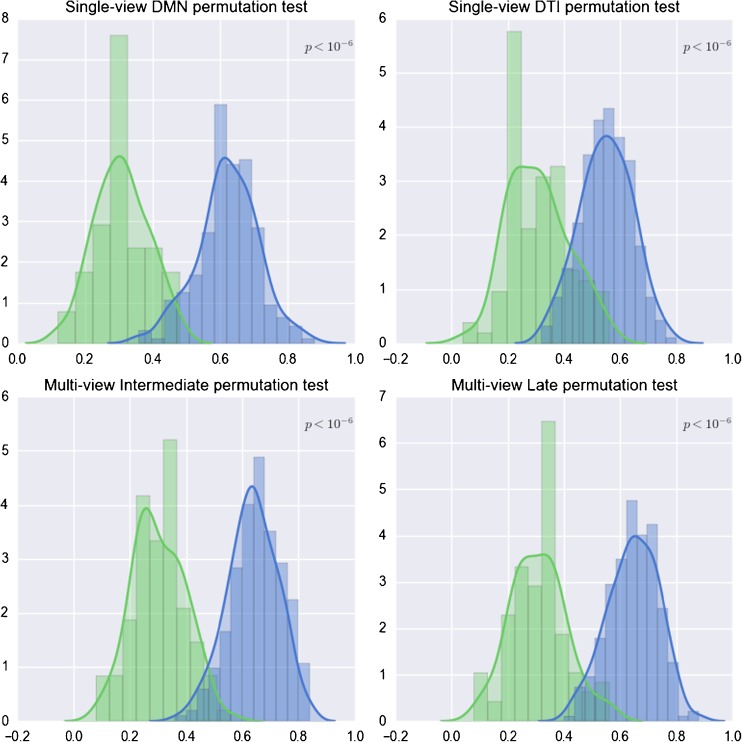
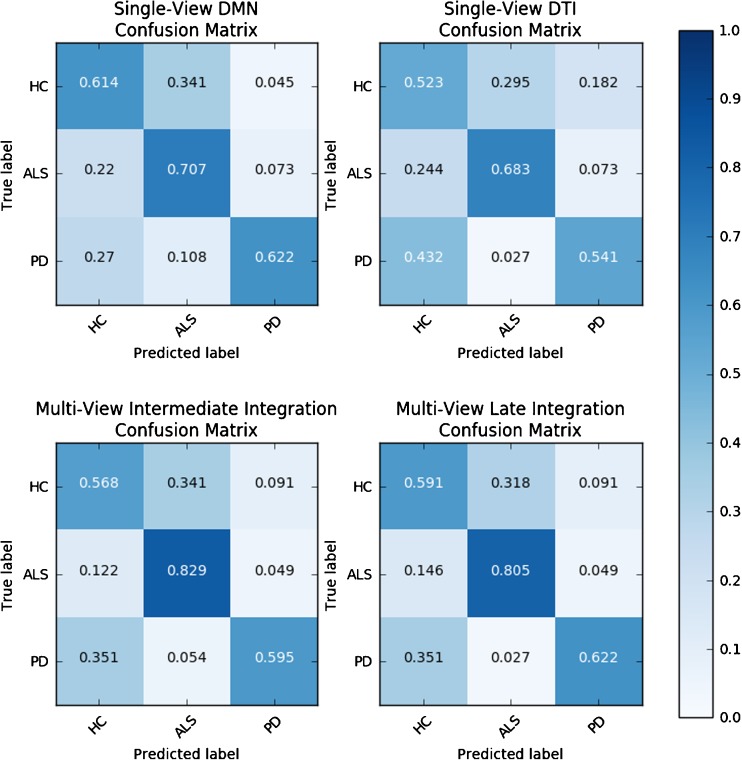
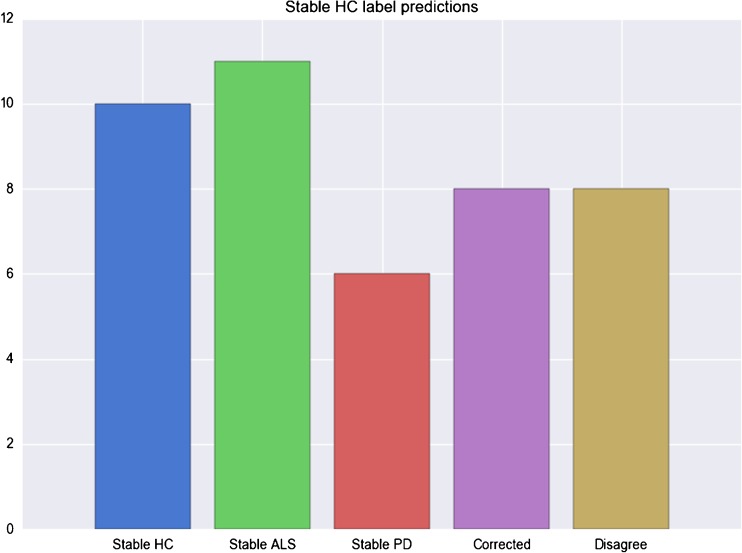
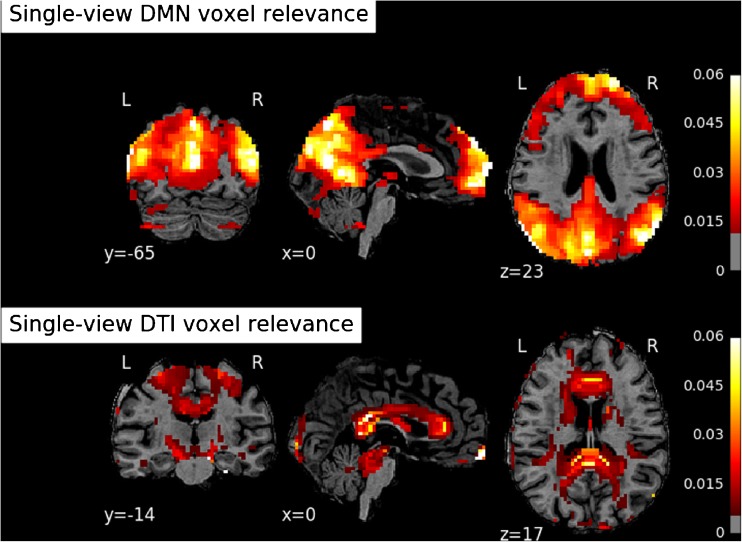
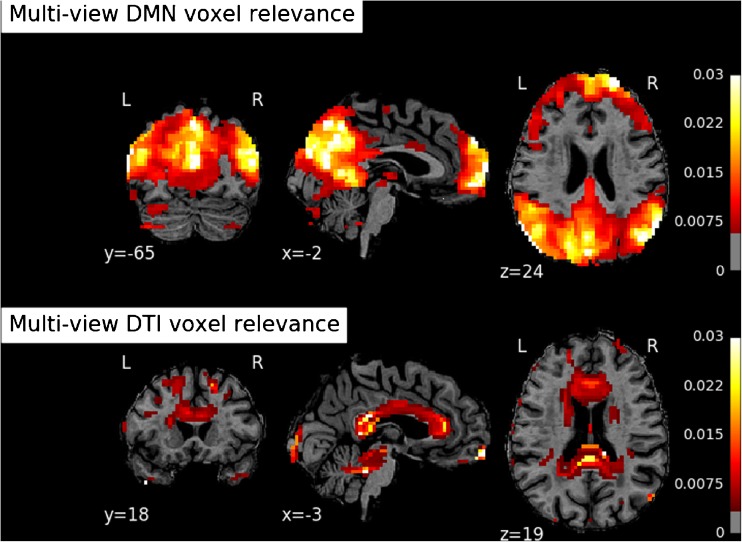
Brain connectivity analyses using voxels as features are not robust enough for single-patient classification because of the inter-subject anatomical and functional variability. To construct more robust features, voxels can be aggregated into clusters that are maximally coherent across subjects. Moreover, combining multi-modal neuroimaging and multi-view data integration techniques allows generating multiple independent connectivity features for the same patient. Structural and functional connectivity features were extracted from multi-modal MRI images with a clustering technique, and used for the multi-view classification of different phenotypes of neurodegeneration by an ensemble learning method (random forest). Two different multi-view models (intermediate and late data integration) were trained on, and tested for the classification of, individual whole-brain default-mode network (DMN) and fractional anisotropy (FA) maps, from 41 amyotrophic lateral sclerosis (ALS) patients, 37 Parkinson's disease (PD) patients and 43 healthy control (HC) subjects. Both multi-view data models exhibited ensemble classification accuracies significantly above chance. In ALS patients, multi-view models exhibited the best performances (intermediate: 82.9%, late: 80.5% correct classification) and were more discriminative than each single-view model. In PD patients and controls, multi-view models' performances were lower (PD: 59.5%, 62.2%; HC: 56.8%, 59.1%) but higher than at least one single-view model. Training the models only on patients, produced more than 85% patients correctly discriminated as ALS or PD type and maximal performances for multi-view models. These results highlight the potentials of mining complementary information from the integration of multiple data views in the classification of connectivity patterns from multi-modal brain images in the study of neurodegenerative diseases.

Keywords: Amyotrophic lateral sclerosis; Default mode network; Fractional anisotropy; Multi-modality; Multi-view; Parkinson’s disease; Random forests.


Conflict of interest statement

Conflict of Interest

The authors declare that they have no conflict of interest.

Figures

Fig. 1
Fig. 1
a Intermediate Data integration model. Preprocessed input images are parcelated by unsupervised clustering. The parcelation is used to compute the features that are concatenated and used to train the MV intermediate integration RF model. The training procedure is performed in nested cross-validation and the resulting best parameters are used to estimate the generalization capability of the model on the held-out fold. b Late Data integration model. Preprocessed input images are parcelated using by unsupervised clustering. The obtained parcelation is used to compute the features that are used to train the SV RFs. The resulting classifications are integrated to generate the MV prediction. The training procedure is performed in nested cross-validation and the best parameters are used to estimate the generalization capability of the model on the held-out fold
Fig. 2
Fig. 2
A decision tree with its decision boundary. Each node of the decision tree represents a portion of the feature space (left). For each data point, its predicted class is obtained by visiting the tree and evaluating the rules of each inner node. When a leaf node is reached, then the corresponding class is returned as the prediction (right)
Fig. 3
Fig. 3
Training schedule used for each SV and MV model. The data is recursively partitioned into outer and inner training and test sets by a nested cross-validation scheme. The inner train/test splits are used to estimate the best parameters configurations, whereas the outer train/test splits are used to estimate the generalization capabilities of the models trained with the best performing configurations of parameters
Fig. 4
Fig. 4
Distribution of the generalization accuracies (blue histograms) estimated for each SV and MV model. The null distribution of the generalization accuracy (green histograms) is computed by permuting the labels of the dataset and repeating the training 500 times for each model to obtain the significance of the statistical test
Fig. 5
Fig. 5
Class-specific accuracies computed for each SV and MV model reported as confusion matrices. Each row reports the percent of subjects belonging to each class, whereas each column corresponds to the percent of subjects belonging to a predicted class
Fig. 6
Fig. 6
Stable label predictions for HC subjects partitioned based on the behaviour of the predicted labels computed by sampling 100 different training sets for each HC
Fig. 7
Fig. 7
Voxel cluster relevance maps (triplanar reslicing: coronal, sagittal, transversal) computed from the single-view Random Forests. Upper row: DMN view. Bottom row: FA view
Fig. 8
Fig. 8
Voxel cluster relevance maps (triplanar reslicing: coronal, sagittal, transversal) computed from the multi-view intermediate integration Random Forest. Upper row: DMN view; Bottom row: FA view

References

    1. Agosta F, Canu E, Valsasina P, et al. Divergent brain network connectivity in amyotrophic lateral sclerosis. Neurobiology of Aging. 2013;34:419–427. doi: 10.1016/j.neurobiolaging.2012.04.015. - DOI - PubMed
    1. Aquino D, Contarino V, Albanese A, et al. Substantia nigra in Parkinson’s disease: a multimodal MRI comparison between early and advanced stages of the disease. Neurological Sciences. 2014;35:753–758. doi: 10.1007/s10072-013-1595-2. - DOI - PubMed
    1. Arbabshirani MR, Plis SM, Sui J, Calhoun VD. Single subject prediction of brain disorders in neuroimaging: promises and pitfalls. NeuroImage. 2015 - PMC - PubMed
    1. Archer KJ, Kimes RV. Empirical characterization of random forest variable importance measures. Computational Statistics and Data Analysis. 2008;52:2249–2260. doi: 10.1016/j.csda.2007.08.015. - DOI
    1. Basser PJ, Jones DK. Diffusion-tensor MRI: theory, experimental design and data analysis – a technical review. NMR in Biomedicine. 2002;15:456–467. doi: 10.1002/nbm.783. - DOI - PubMed