

Electrostatic Forces as Dominant Interactions Between Proteins and Polyanions: an ESI MS Study of Fibroblast Growth Factor Binding to Heparin Oligomers
- PMID: 28211013
- PMCID: PMC5808462
- DOI: 10.1007/s13361-017-1596-0
Electrostatic Forces as Dominant Interactions Between Proteins and Polyanions: an ESI MS Study of Fibroblast Growth Factor Binding to Heparin Oligomers
Abstract
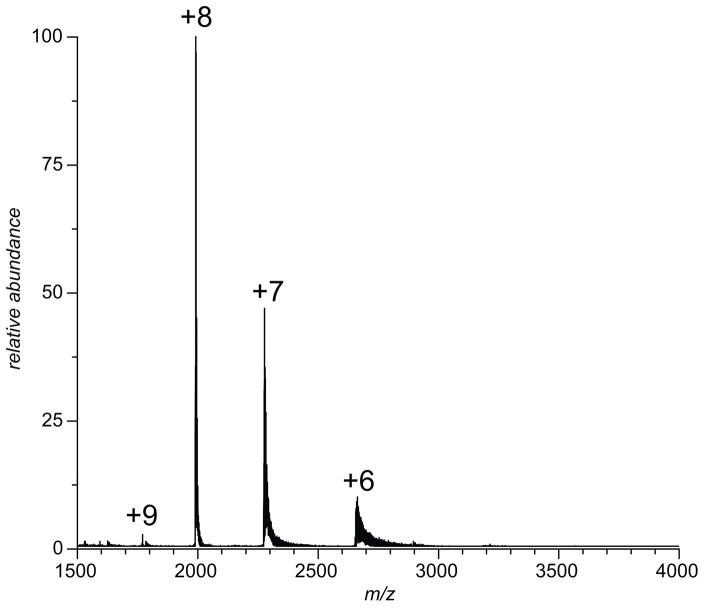
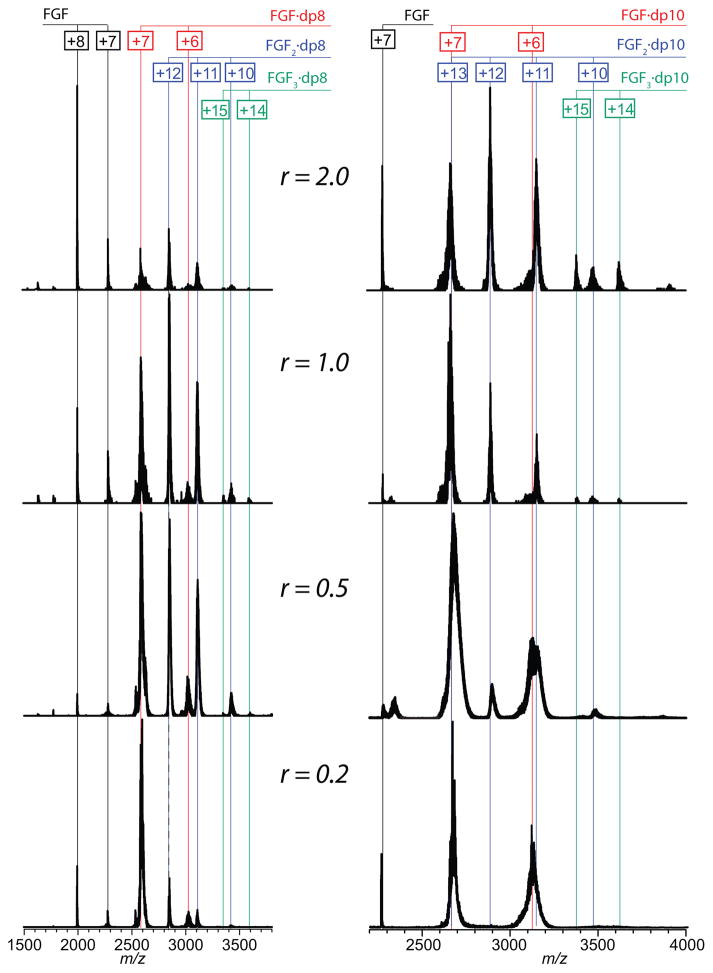
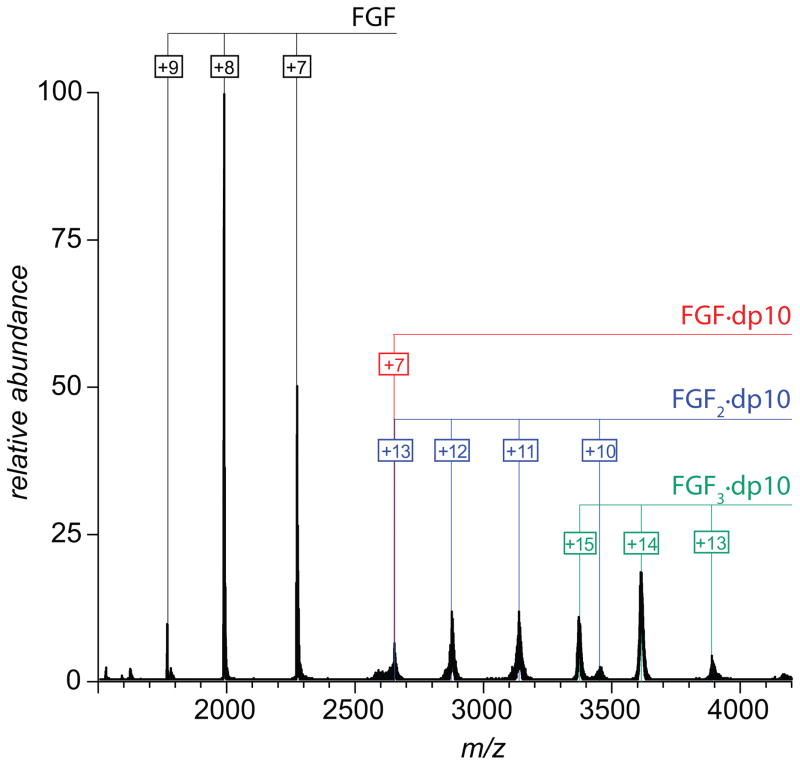
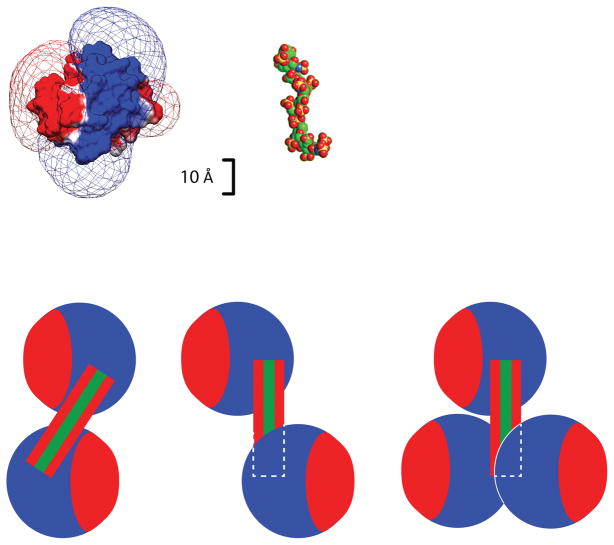
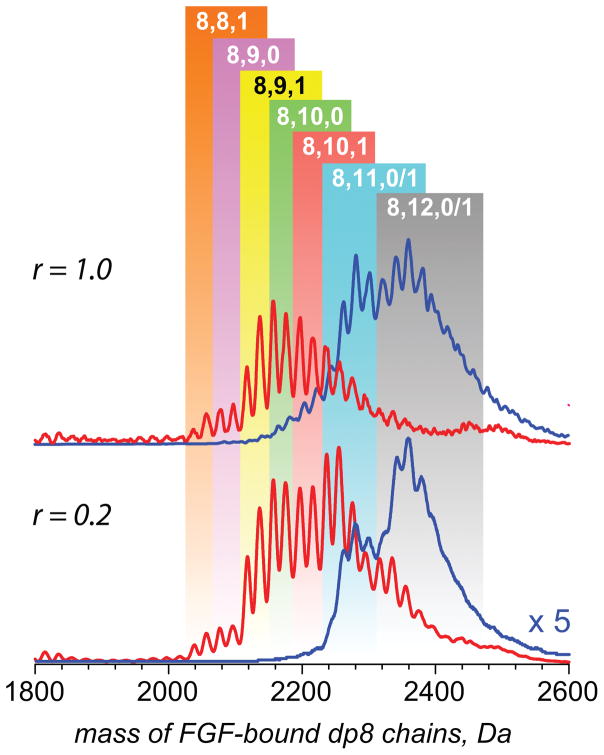
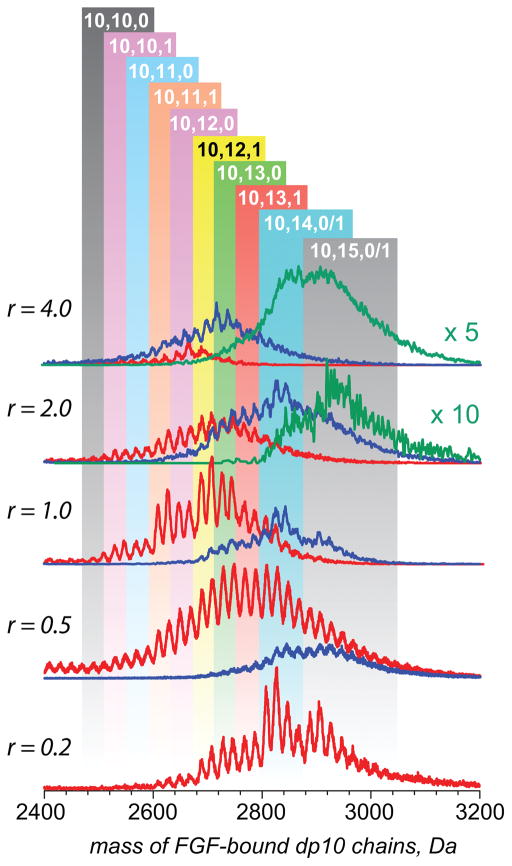
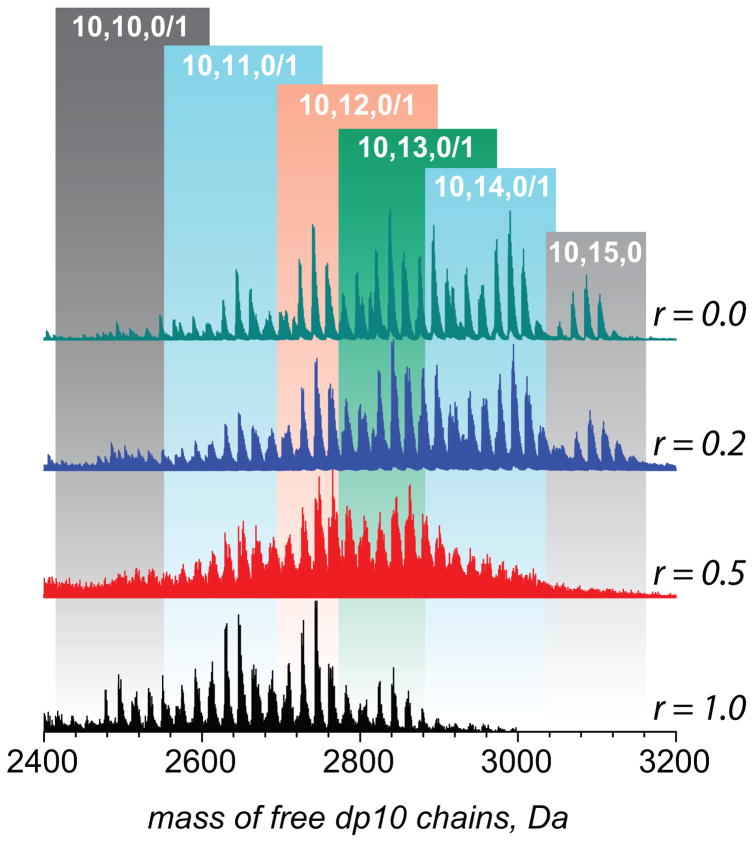
The interactions between fibroblast growth factors (FGFs) and their receptors (FGFRs) are facilitated by heparan sulfate (HS) and heparin (Hp), highly sulfated biological polyelectrolytes. The molecular basis of FGF interactions with these polyelectrolytes is highly complex due to the structural heterogeneity of HS/Hp, and many details still remain elusive, especially the significance of charge density and minimal chain length of HS/Hp in growth factor recognition and multimerization. In this work, we use electrospray ionization mass spectrometry (ESI MS) to investigate the association of relatively homogeneous oligoheparins (octamer, dp8, and decamer, dp10) with acidic fibroblast growth factor (FGF-1). This growth factor forms 1:1, 2:1, and 3:1 protein/heparinoid complexes with both dp8 and dp10, and the fraction of bound protein is highly dependent on protein/heparinoid molar ratio. Multimeric complexes are preferentially formed on the highly sulfated Hp oligomers. Although a variety of oligomers appear to be binding-competent, there is a strong correlation between the affinity and the overall level of sulfation (the highest charge density polyanions binding FGF most strongly via multivalent interactions). These results show that the interactions between FGF-1 and Hp oligomers are primarily directed by electrostatics, and also demonstrate the power of ESI MS as a tool to study multiple binding equilibria between proteins and structurally heterogeneous polyanions. Graphical Abstract ᅟ.
Keywords: Glycosaminoglycans; Heparin; Native electrospray ionization mass spectrometry; Noncovalent interactions; Polyelectrolytes.
Figures
References
-
- Habuchi H, Habuchi O, Kimata K. Sulfation pattern in glycosaminoglycan: does it have a code? Glycoconj J. 2004;21:47–52. - PubMed
-
- Lamanna WC, Kalus I, Padva M, Baldwin RJ, Merry CL, Dierks T. The heparanome - the enigma of encoding and decoding heparan sulfate sulfation. J Biotechnol. 2007;129:290–307. - PubMed
-
- Gama CI, Tully SE, Sotogaku N, Clark PM, Rawat M, Vaidehi N, et al. Sulfation patterns of glycosaminoglycans encode molecular recognition and activity. Nat Chem Biol. 2006;2:467–473. - PubMed
-
- Bishop JR, Schuksz M, Esko JD. Heparan sulphate proteoglycans fine-tune mammalian physiology. Nature. 2007;446:1030–1037. - PubMed
MeSH terms
Substances
Grants and funding
LinkOut - more resources
Full Text Sources
Other Literature Sources
Medical
Research Materials
Miscellaneous
