. 2017 Feb 17;12(2):e0172344.
doi: 10.1371/journal.pone.0172344. eCollection 2017.

Genetically encoded ratiometric fluorescent thermometer with wide range and rapid response

Affiliations

Genetically encoded ratiometric fluorescent thermometer with wide range and rapid response

Masahiro Nakano et al. PLoS One. .

Abstract

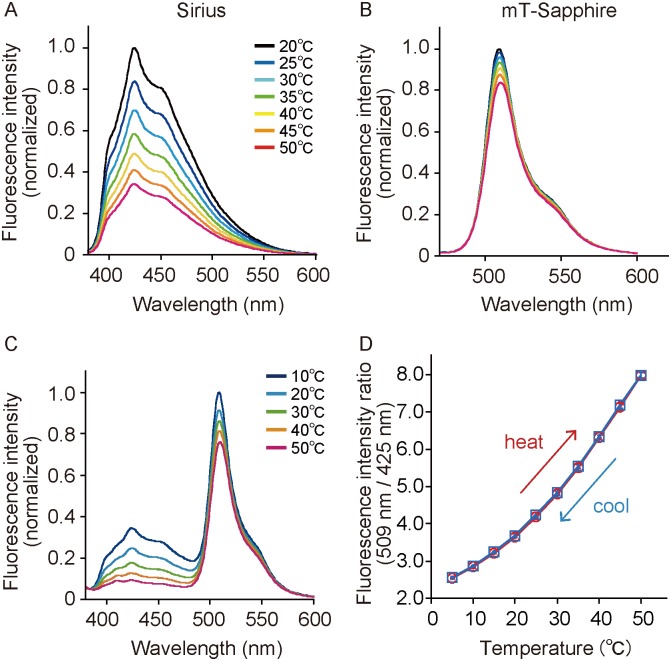
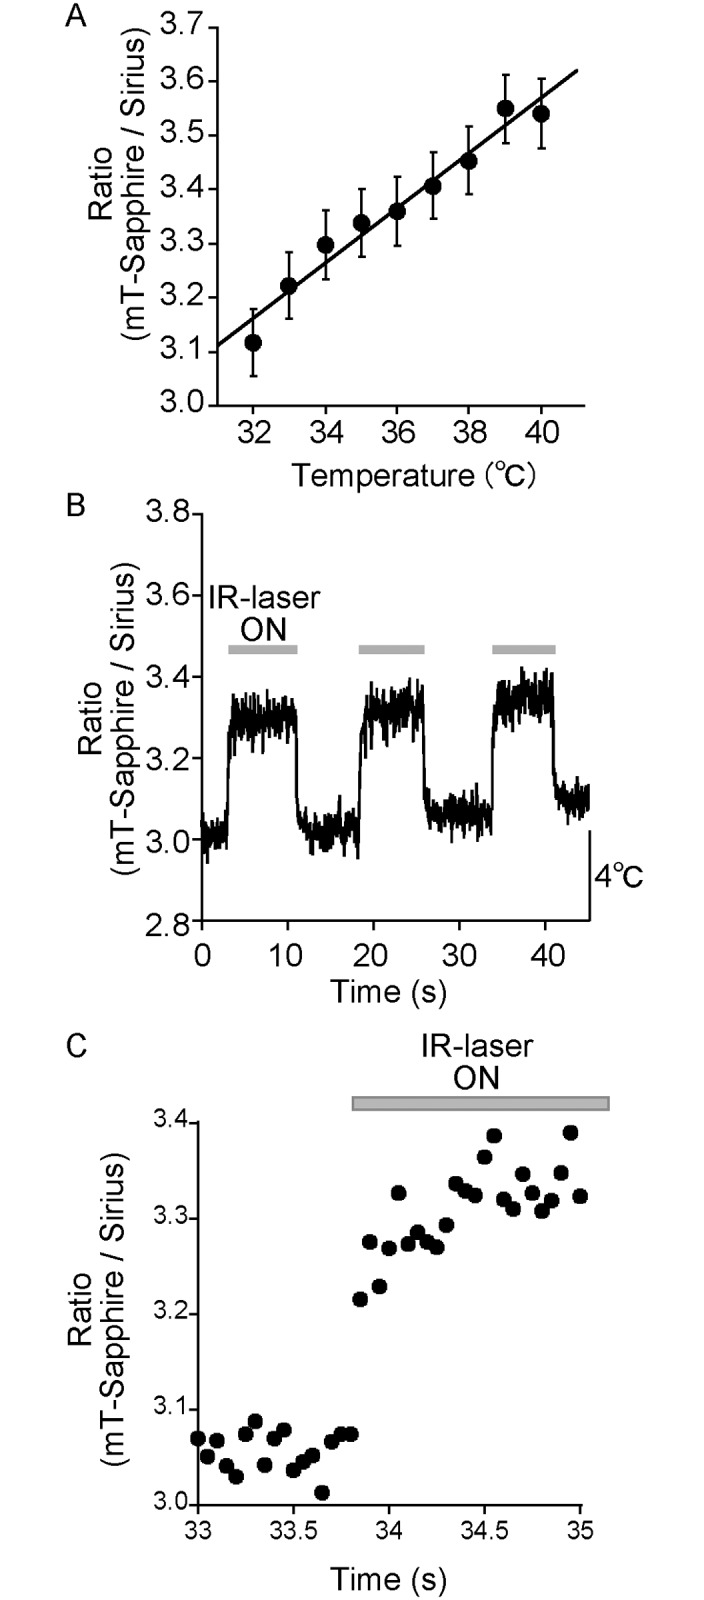
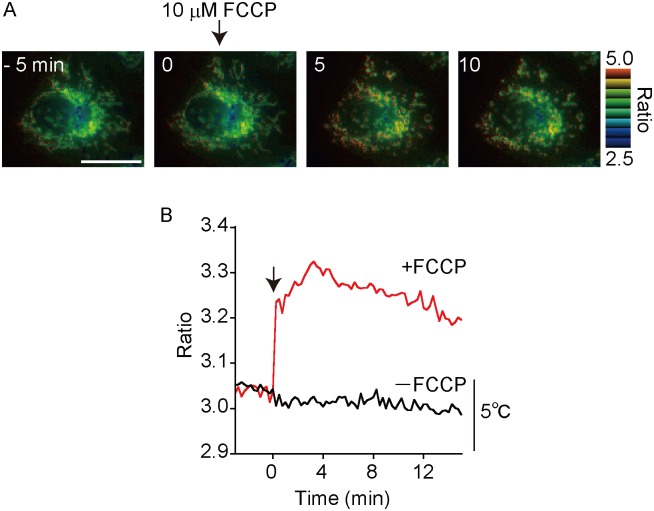
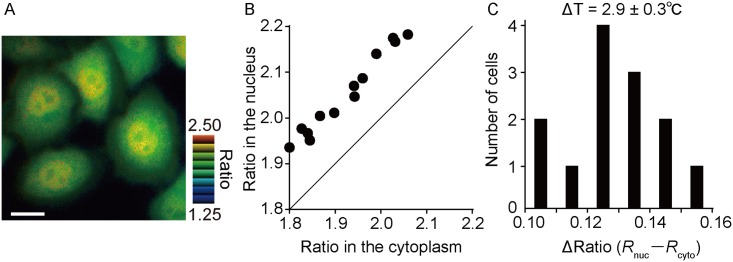
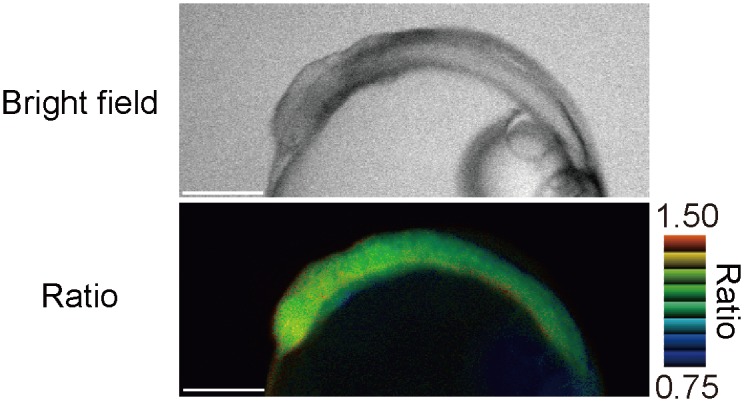
Temperature is a fundamental physical parameter that plays an important role in biological reactions and events. Although thermometers developed previously have been used to investigate several important phenomena, such as heterogeneous temperature distribution in a single living cell and heat generation in mitochondria, the development of a thermometer with a sensitivity over a wide temperature range and rapid response is still desired to quantify temperature change in not only homeotherms but also poikilotherms from the cellular level to in vivo. To overcome the weaknesses of the conventional thermometers, such as a limitation of applicable species and a low temporal resolution, owing to the narrow temperature range of sensitivity and the thermometry method, respectively, we developed a genetically encoded ratiometric fluorescent temperature indicator, gTEMP, by using two fluorescent proteins with different temperature sensitivities. Our thermometric method enabled a fast tracking of the temperature change with a time resolution of 50 ms. We used this method to observe the spatiotemporal temperature change between the cytoplasm and nucleus in cells, and quantified thermogenesis from the mitochondria matrix in a single living cell after stimulation with carbonyl cyanide 4-(trifluoromethoxy)phenylhydrazone, which was an uncoupler of oxidative phosphorylation. Moreover, exploiting the wide temperature range of sensitivity from 5°C to 50°C of gTEMP, we monitored the temperature in a living medaka embryo for 15 hours and showed the feasibility of in vivo thermometry in various living species.


Conflict of interest statement

Competing Interests: The authors have declared that no competing interests exist.

Figures

Fig 1
Fig 1. Temperature dependency of Sirius, mT-Sapphire, and equimolar mixtures of Sirius and mT-Sapphire proteins.
(A) Temperature-dependent fluorescence spectrum of Sirius. The wavelength at 360 ± 10 nm was used for excitation. (B) Temperature-dependent fluorescence spectrum of mT-Sapphire. The wavelength at 400 ± 10 nm was used for excitation. (C) Temperature-dependent fluorescence spectrum of equimolar mixtures of the two FPs. The wavelength at 360 ± 10 nm was used for excitation. (D) Temperature-dependent fluorescence intensity ratio (open red circle and open blue square) of the equimolar mixtures of the two FPs from 5°C to 50°C. The ratio value was plotted against the solution temperature (n = 3). Red and blue lines show the increase in temperature from 5°C to 50°C and the decrease in the opposite direction, respectively. The detailed method for the calculation of the ratio was described in the Methods section. Error bars indicate the standard error (s.e.m.).
Fig 2
Fig 2. Effects of various ion concentrations on temperature sensing by the equimolar mixtures of Sirius and mT-Sapphire proteins.
(A) Temperature-dependent fluorescence intensity ratio of the equimolar mixtures of the two FPs at various K+ concentrations. (B) Temperature-dependent fluorescence intensity ratio of the equimolar mixtures of the two FPs at various Ca2+ concentrations. (C) Temperature-dependent fluorescence intensity ratio of the equimolar mixtures of the two FPs at various Mg2+ concentrations. (D) pH-dependent fluorescence intensity ratio (509/425 nm) of the equimolar mixtures of the two FPs at various temperature. Cyan; 20°C, yellow-green; 30°C, orange; 40°C. A solution containing 30 mM trisodium citrate and 30 mM borax adjusted to pH 6.0, 7.0, and 8.0 was used. Error bars indicate the s.e.m. (n = 3).
Fig 3
Fig 3. Monitoring temperature in cells with gTEMP.
(A) Temperature-dependent fluorescence intensity ratio (black circle) of gTEMP expressed in HeLa cell. The ratio in the cytoplasm was plotted against the cellular medium temperature (n = 20). Relative temperature resolution was 0.5°C. (B) Time course of the ratio of gTEMP in a HeLa cell upon IR-laser irradiation. The IR laser was focused in the cytoplasm. We measured and plotted the fluorescence intensity ratio of gTEMP at the focus of the IR laser. The recording rate was 20 fps. The medium temperature was 28°C. (C) The extended figure from (B). Error bars in (A) indicate the s.e.m.
Fig 4
Fig 4. Monitoring temperature change in mitochondria.
(A) Pseudo-colored ratio image of gTEMP expressed in mitochondria of a HeLa cell upon FCCP stimulation. At time = 0 min, 10 μM FCCP was added to the cell. (B) Time course of the ratio in mitochondria with FCCP and without FCCP. The temperature scale (5°C) in Fig 4B was estimated from the slope value (0.031 ratio/°C) of S5 Fig. The medium temperature was 37°C. Scale bars indicate 20 μm (A).
Fig 5
Fig 5. Monitoring temperature difference in cells.
(A) Pseudo-colored ratio image of gTEMP ubiquitously expressed in a HeLa cell. (B) Plot of gTEMP ratio in cytoplasm and nucleus regions in each HeLa cell (n = 13). (C) Histogram of the gTEMP ratio difference between cytoplasm and nucleus regions converted from (B). The average temperature difference in Fig 5C was 2.9 ± 0.3°C estimated from the slope value (0.045 ratio/°C) of S6 Fig. The medium temperature was 37°C. Scale bar indicates 20 μm (A).
Fig 6
Fig 6. Monitoring temperature in medaka embryo.
The bright field image (upper) and pseudo-colored ratio image (bottom) of gTEMP expressed in a medaka embryo. The medium temperature was 25°C. Scale bars indicate 250 μm.

References

    1. Morimoto RI, Santoro MG. Stress-inducible responses and heat shock proteins: new pharmacologic targets for cytoprotection. Nat Biotechnol. 1998;16(9):833–8. 10.1038/nbt0998-833 - DOI - PubMed
    1. Yatsu R, Miyagawa S, Kohno S, Saito S, Lowers RH, Ogino Y, et al. TRPV4 associates environmental temperature and sex determination in the American alligator. Sci Rep. 2015;5:18581 10.1038/srep18581 - DOI - PMC - PubMed
    1. Kitano T, Hayashi Y, Shiraishi E, Kamei Y. Estrogen rescues masculinization of genetically female medaka by exposure to cortisol or high temperature. Mol Reprod Dev. 2012;79(10):719–26. 10.1002/mrd.22080 - DOI - PubMed
    1. Gota C, Okabe K, Funatsu T, Harada Y, Uchiyama S. Hydrophilic fluorescent nanogel thermometer for intracellular thermometry. J Am Chem Soc. 2009;131(8):2766–7. 10.1021/ja807714j - DOI - PubMed
    1. Yang JM, Yang H, Lin L. Quantum dot nano thermometers reveal heterogeneous local thermogenesis in living cells. ACS Nano. 2011;5(6):5067–71. 10.1021/nn201142f - DOI - PubMed

Substances