Review
. 2017 Mar:132:3-33.
doi: 10.1016/j.visres.2017.01.006. Epub 2017 Feb 27.

Vision science and adaptive optics, the state of the field

Affiliations
Review

Vision science and adaptive optics, the state of the field

Susana Marcos et al. Vision Res. 2017 Mar.

Abstract

Adaptive optics is a relatively new field, yet it is spreading rapidly and allows new questions to be asked about how the visual system is organized. The editors of this feature issue have posed a series of question to scientists involved in using adaptive optics in vision science. The questions are focused on three main areas. In the first we investigate the use of adaptive optics for psychophysical measurements of visual system function and for improving the optics of the eye. In the second, we look at the applications and impact of adaptive optics on retinal imaging and its promise for basic and applied research. In the third, we explore how adaptive optics is being used to improve our understanding of the neurophysiology of the visual system.

Keywords: Adaptive optics; Retina; Retinal physiology; Vision science.


Figures

Figure 1
Figure 1
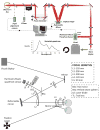
Examples of implentations of Adaptive Optics systems for visual psychophysics. A. AO simulator at LOUM-Universidad de Murcia (courtesy of Pablo Artal). B. Schematic layout of binocular AO system at Bradford University (courtesy of Karen Hampson).
Figure 2
Figure 2
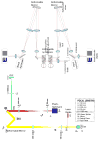
Examples of implentations of Adaptive Optics systems for visual psychophysics. Top. Schematic layout of AO system at Laboratoire Aimé Cotton, Université Paris Sud 11 (courtesy of Richard Legras). Bottom: Schematic layout of AO system at KTH (courtesy of Linda Lundström).
Figure 3
Figure 3
Examples of implentations of Adaptive Optics systems for visual psychophysics. Top:. Schematic layout of AO system at Center fof Visual Science, University of Rochester (courtesy of Geungyoung Yoon). Bottom: Schematic Layout of AO system at Queensland University of Technology (courtesy of David Atchison).
Figure 4
Figure 4
Examples of. polychromatic AO system at VIOBIO Lab, Instituto de Optica (CSIC) (courtesy of Maria Vinas and Susana Marcos).
Figure 5
Figure 5
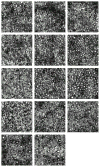
AO-SLO images of the cone and rod mosaic at locations spanning 30° NR to 30° TR for a normal human subject. Logarithmic intensity scaling to enhance the visualization of the rod photoreceptors. Each image is the registered average of ~50 frames. The scale bar is 25 μm. At large eccentricities an increase in the rod spacing was observed. (Wells-Gray et al., 2016)
Figure 6
Figure 6
Figures show an example image of the cone mosaic overlaid in green with intensity patterns (retinal stimulation) that would result from stimuli presented to the retina. Panel a) shows sharp Landolt C, panel b) shows a Landolt C blurred by the optical components of the eye, panels c), d), and e) show three examples of the blurred Landolt C translated on the retina by fixational eye movement over a period of 100ms. Images have been scaled to represent a Landolt C with a gap equal to twice the resolution limit of the eye. From Young et al. (in prep.)
Figure 7
Figure 7
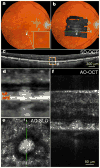
Multimodal imaging of SDD. (a), Color fundus photograph. The yellow box (e) is of 300 μm on a side, (b), AOSLO montage overlaid on the fundus photograph. (c), A SD-OCT B-Scan taken along the green arrow-line in panel b shows that this SDD has broken the photoreceptor EZ band. (d), Magnification of boxed area in panel c. (e), The AOSLO image of the boxed retina in panels a and b. The bright spots outside the hyporeflective annuls are photoreceptors, mostly cones. (f), The AO-OCT scan of the SDD, as indicted by the green arrow line in panel e. The scale bar in panel f also applies to panels d and e. All SD-OCT images are in logarithmic grey scale. AO-OCT is in linear grey scale. The subject is an 83-year-old non-Hispanic man of European-descendant with intermediate stage non-neovascular AMD. (From Y. Zhang, unpublished)
Figure 8
Figure 8
Adaptive optics scanning ophthalmoscope sketch, flattened for clarity. PMT stands for photomultiplier, TZ for transimpedance amplifier, LD for laser diode, SLD for superluminescent diode, SH-WS for Shack-Hartmann wavefront sensor, sph for spherical mirror and F for interferometric band pass filter. The letter P indicates the pupil conjugate planes, in addition to the ones corresponding to the deformable mirror, the optical scanners and the SH-WS. (From Dubra & Sulai, 2011)
Figure 9
Figure 9
Schematic of the Indiana MHz AO-OCT system. The in-the-plane sample arm (lower right) contains a 97-actuator ALPAO mirror (DM1) and Shack-Hartmann wavefront sensor (WS) for correction of ocular and system monochromatic aberrations; a custom achromatizing lens (ACL) for correcting ocular chromatic aberrations; and three custom toroidal mirrors (TM1, TM2, and TM3) for correction of astigmatism generated by the off-axis use of spherical mirrors. The detection arm (left) achieves megahertz imaging speed using a quadplex spectrometer design. Custom AO control software was developed in Matlab (Mathworks, Natick, MA) and incorporated the ALPAO Core Engine (ACE) Matlab libraries. See Kocaoglu et al. (2014) for details.
Figure 10
Figure 10
Images acquired with AO ultrahigh-resolution OCT. In a log-scale B-scan focused on the outer retina (A), the ELM, IS/OS, and COST bands are clearly visible, demarcating the IS and OS of the cones. In a linear-scale, magnified view (B), the IS/OS and COST reflections from individual cones are clearly visible, with red and yellow boxes outlining the relatively transparent individual inner and outer segments. The width of the bright reflections is consistent with known inner segment widths, while their height is comparable to the axial PSF height, which suggests origination at thin reflectors. Axial displacement of neighboring reflectors is apparent in both layers. When focus is shifted to the inner retina (C), individual nerve fiber bundles, up to 50 μm in diameter but separated as little as 5 μm, become visible. A magnified view of the latter (D) reveals capillaries (arrows) laying in multiple plexuses. These individual structures of the inner and outer retina appear as uniform bands in clinical OCT images. (From Jonnal et al., 2016).
Figure 11
Figure 11. Stimulus geometry and delivered light distribution
A, AOSLO image of cone mosaic at 3.1° eccentricity, with outlined area scaled up in B–E. B, Cone reflectance profiles at this eccentricity span ~7 pixels, nearly 5 μm in diameter. Stimuli were specified in image pixels, a 3 × 3 pixel square stimulus in this example. C, Light intensity delivered to the retina is estimated by convolving the stimulus geometry with the diffraction-limited PSF of the eye (see Materials and Methods). Intensity contours show that the light spreads over a broader area than the 3 × 3 specification. D, Plot of actual delivery locations of the stimulus center relative to the targeted cone for a 22-trial psychophysical run. Positional delivery errors in eye motion correction caused stimulus deliveries to be jittered from trial to trial. E, Cumulative distribution of light delivery on the retina during the run in D, derived from the diffraction-limited stimulus integrated over the actual delivery locations. Transverse chromatic aberration was assumed to be constant for this analysis. from Figure 2 in Harmening et al. (2014) J. Neurosci.
Fig. 12
Fig. 12
Adaptive-optics two-photon microscope at the University of Murcia, Spain. Image examples of collagen fibers in the cornea.
Fig. 13
Fig. 13
Two-photon excitation imaging system (TPM) for mouse retina and RPE. (A) TPM system layout. DC stands for group velocity dispersion pre–compensation; EOM - electro–optic modulator; DM6000 - upright microscope; PMT - photomultiplier tube. (B) Dichroic mirror (DCh) and barrier filter 680 SPET separate fluorescence and excitation light. (C) Layout of the adaptive optics system. FMK1 and FMK2 stand for fold mirrors on kinematic magnetic bases; L1, L2, L3 and L4 - lenses; DM - deformable mirror; FM1, FM2 and FM3 - fold mirrors. (D) Left panel, RPE image in an ex vivo 1-month-old Abca4−/−Rdh8−/− mouse after exposure to bright light, obtained with (top image) and without (bottom image) DC; right panel, mean fluorescence measured with and without DC; error bars indicate S.D, n=3. (Palczewska et al, 2014)

References

    1. Alexander NS, Palczewska G, Stremplewski P, Wojtkowski M, Kern TS, Palczewski K. Image registration and averaging of low laser power two-photon fluorescence images of mouse retina. Biomedical Optics Express. 2016;7:2671–2691. doi: 10.1364/BOE.7.002671. - DOI - PMC - PubMed
    1. Artal P, Chen L, Fernández EJ, Singer B, Manzanera S, Williams DR. Neural adaptation for the eye’s optical aberrations. Journal of Vision. 2004;4:281–287. doi: 10.1167/4.4.4. - DOI - PubMed
    1. Artal P, Manzanera S, Piers P, Weeber H. Visual effect of the combined correction of spherical and longitudinal chromatic aberrations. Optics Express. 2010;18:1637–1648. doi: 10.1364/OE.18.001637. - DOI - PubMed
    1. Artal P, Schwarz C, Cánovas C, Mira-Agudelo A. Night myopia studied with an adaptive optics visual analyzer. PLoS ONE. 2012;7(7):e40239. doi: 10.1371/journal.pone.0040239. - DOI - PMC - PubMed
    1. Atchison DA, Guo H. Subjective blur limits for higher order aberrations. Optometry and Vision Science. 2010;87:890–898. doi: 10.1097/OPX.0b013e3181f6fb99. - DOI - PubMed

Publication types