. 2017 Apr 15:150:213-229.
doi: 10.1016/j.neuroimage.2017.02.036. Epub 2017 Feb 16.

The global signal in fMRI: Nuisance or Information?

Affiliations

The global signal in fMRI: Nuisance or Information?

Thomas T Liu et al. Neuroimage. .

Abstract

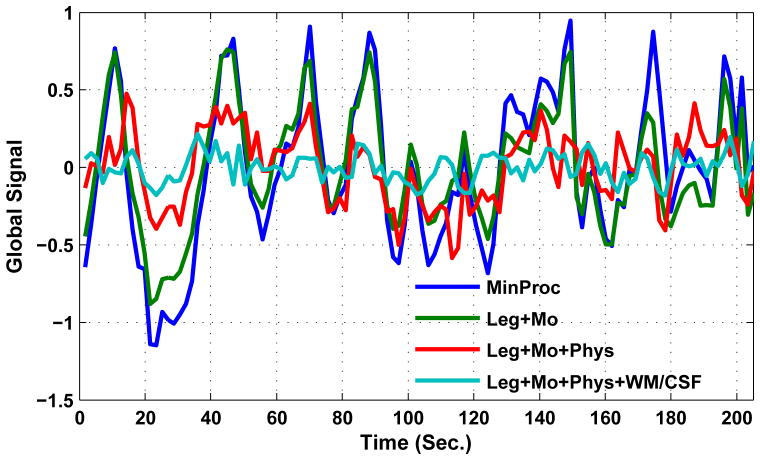
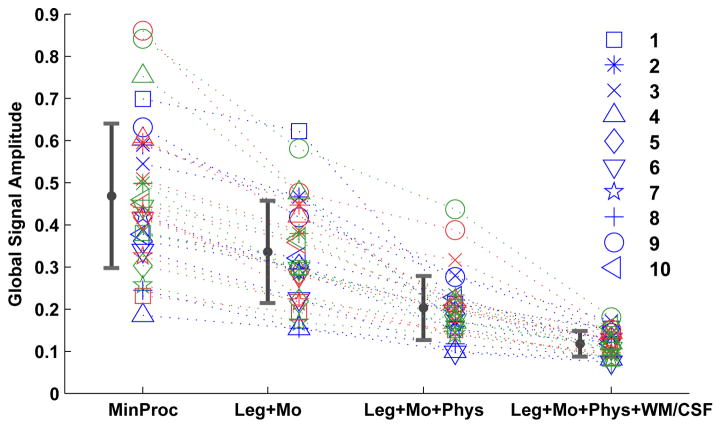
The global signal is widely used as a regressor or normalization factor for removing the effects of global variations in the analysis of functional magnetic resonance imaging (fMRI) studies. However, there is considerable controversy over its use because of the potential bias that can be introduced when it is applied to the analysis of both task-related and resting-state fMRI studies. In this paper we take a closer look at the global signal, examining in detail the various sources that can contribute to the signal. For the most part, the global signal has been treated as a nuisance term, but there is growing evidence that it may also contain valuable information. We also examine the various ways that the global signal has been used in the analysis of fMRI data, including global signal regression, global signal subtraction, and global signal normalization. Furthermore, we describe new ways for understanding the effects of global signal regression and its relation to the other approaches.

Keywords: General linear model; Global signal; Motion; Physiological noise; Vigilance; fMRI.


Figures

Figure 1
Figure 1
Examples of global signal time series computed after (1) minimal preprocessing (MinProc, blue), (2) MinProc plus removal of low-frequency (Leg: Legendre polynomial) and motion-related (Mo) nuisance terms (Leg+Mo; green), (3) MinProc plus removal of low-frequency, motion-related, and physiological (Phys) nuisance terms (Leg+Mo+Phys; red), and (3) MinProc plus removal of low-frequency, motion-related, physiological, and white matter and cerebral spinal fluid (WM/CSF) nuisance terms (Leg+Mo+Phys+WM/CSF; cyan). WM and CSF regions were defined using partial volume thresholds of 0.99 for each tissue type and morphological erosion of two voxels in each direction to minimize partial voluming with gray matter. Additional details about the processing are provided in (Wong et al., 2013).
Figure 2
Figure 2
Global signal amplitude (in units of percent change) as a function of preprocessing approach for 30 scans. Bars indicate mean plus or minus one standard deviation. With respect to the MinProc set, the means of the normalized variances of the global signals are 0.52, 0.21 and 0.07 for the Leg+Mo, Leg+Mo+Phys, and Leg+Mo+Phy+WM/CSF sets, respectively. As an example, this means that the variances of the global signal in the Leg+Mo set are on average 52% of the respective variances of the global signals in the MinProc set. These data are from the eyes-closed scans in the pre-dose control, post-dose control, and pre-dose caffeine sessions described in (Wong et al., 2013)
Figure 3
Figure 3
The global signal is highly correlated with the signals from the great vein of Galen (red) and the sagittal sinus (black).
Figure 4
Figure 4
Global signal (green) is negatively correlated with EEG vigilance time course (blue; inverted for display) over the course of a scan. Examples of images that occur near vigilance peaks (and valleys in the global signal) are shown below the plot, while images that occur near vigilance valleys (and peaks in the global signal) are shown above the plot.
Figure 5
Figure 5
Spatiotemporal templates (upper right) are estimated using the approach of (Majeed et al., 2011). A sparse estimation approach is then used to estimate the optimal weighted sum of templates that best fits the original data, with the estimated weights shown in lower right of the figure. The global signal of the original data (blue) is highly correlated (r = 0.78) with the global signal of the weighted sum.
Figure 6
Figure 6
Posterior-cingulate cortex (PCC) and white-matter (WM) seed correlation maps obtained prior to GSR and after the application of GSR, global signal normalization (GSN), and global signal subtraction (GSS). Consistent with the approximation shown in Appendix C, GSN and GSS yield nearly identical maps for all scans. The cosine similarities between the GSR and GSS maps are indicated by the values listed at the bottom along with the corresponding GSR fit coefficients for the seed time courses. As the fit coefficient values approach 1.0, the GSR and GSS maps become more similar.
Figure 7
Figure 7
Cosine similarity between the connectivity maps obtained after GSR and GSS for PCC (blue) and WM (red) seed time courses versus the corresponding GSR fit coefficients. Similarity values are very high (r > .90) when the fit coefficients are close to 1.0 (at which point GSR and GSS are equivalent operations with respect to the seed time course). As the fit coefficient deviates from 1.0, the similarity values decrease for both seeds, rather sharply for the WM seed and relatively slowly for the PCC seed. A Gaussian fit R2 = 0.74 is shown by the black-dashed line.
Figure 8
Figure 8
Approximating the effects of GSR with temporal downweighting and censoring. (a) Examples of brain images from a representative subject and slice prior to (uncorrected) and after the application of GSR (2nd and 3rd rows, respectively) are shown. Global signal values for the uncorrected images are indicated by the colored bars in the first row. The GSR ratios are indicated by the colored bars in the 4th row, and reflect the average downweighting due to GSR at each time point. Multiplication of the uncorrected images by the GSR ratio yields the downweighted images in the 5th row. In the 6th row, images at time points for which the expected GSR ratio is less than 0.5 are censored (i.e. multiplied by zero) while the uncorrected images are retained for the remaining time points. (b) The GSR ratio decreases as an approximately linear function of the global signal magnitude. Each dot represents the GSR ratio from a single time point from one of 68 scans (a total of 12580 time points). The dashed red-line indicates a censoring function that multiplies images by zero when the expected GSR ratio (i.e. linear approximation) is less than 0.5. (c) PCC seed correlation maps obtained before GSR, after GSR, and after application of GSR ratio weighting, and GS censoring. Maps are shown for 10 representative scans. For GS censoring, time points with an expected GSR ratio of less than 0.5 were censored, and the percentage of time points censored is indicated at the bottom. (d) The average GSR ratio for each scan (computed as the mean of GS ratios across all time points within a scan) is plotted versus the global 50 signal amplitude for that scan (computed as the standard deviation of the global signal across the scan).

References

    1. Aguirre GK, Zarahn E, D’esposito M. Empirical analyses of BOLD fMRI statistics. II. Spatially smoothed data collected under null-hypothesis and experimental conditions. NeuroImage. 1997 Apr;5(3):199–212. - PubMed
    1. Aguirre GK, Zarahn E, D’esposito M. The inferential impact of global signal covariates in functional neuroimaging analyses. NeuroImage. 1998 Oct;8(3):302–306. - PubMed
    1. Amemiya S, Kunimatsu A, Saito N, Ohtomo K. Cerebral hemodynamic impairment: assessment with resting-state functional MR imaging. Radiology. 2014 Feb;270(2):548–555. - PubMed
    1. Anderson JS, Druzgal TJ, Lopez-Larson M, Jeong EK, Desai K, Yurgelun-Todd D. Network anticorrelations, global regression, and phase-shifted soft tissue correction. Human Brain Mapping. 2011 Jun;32(6):919–934. - PMC - PubMed
    1. Behzadi Y, Restom K, Liau J, Liu TT. A component based noise correction method (CompCor) for BOLD and perfusion based fMRI. Neuroimage. 2007 Aug;37(1):90–101. - PMC - PubMed

Publication types

MeSH terms