. 2017 Mar;7(3):288-301.
doi: 10.1158/2159-8290.CD-16-0844. Epub 2017 Feb 17.

OTX2 Activity at Distal Regulatory Elements Shapes the Chromatin Landscape of Group 3 Medulloblastoma

Affiliations

OTX2 Activity at Distal Regulatory Elements Shapes the Chromatin Landscape of Group 3 Medulloblastoma

Gaylor Boulay et al. Cancer Discov. 2017 Mar.

Abstract

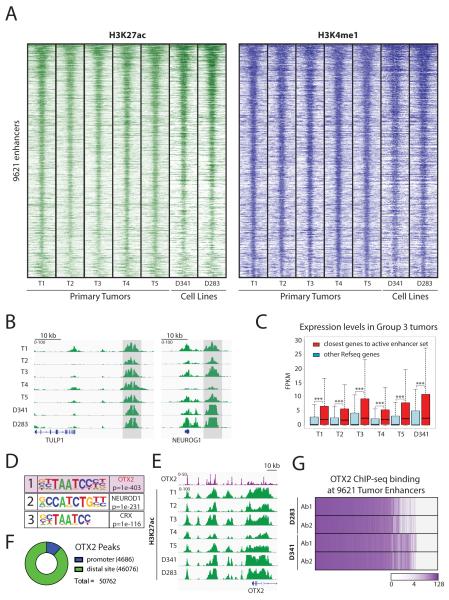
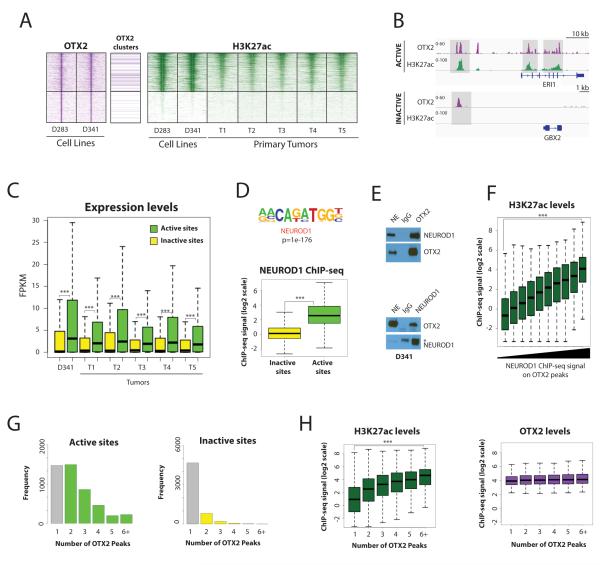
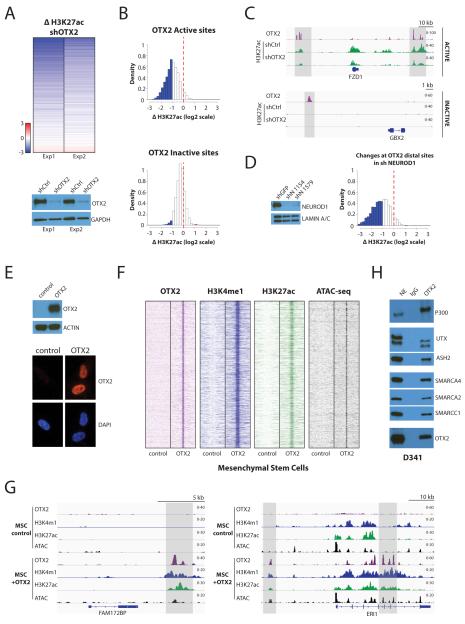
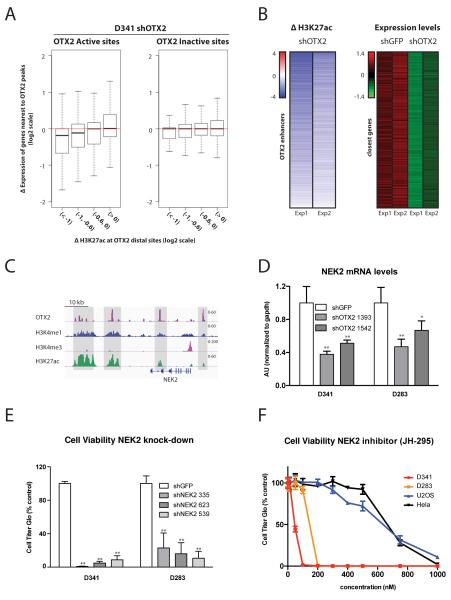
Medulloblastoma is the most frequent malignant pediatric brain tumor and is divided into at least four subgroups known as WNT, SHH, Group 3, and Group 4. Here, we characterized gene regulation mechanisms in the most aggressive subtype, Group 3 tumors, through genome-wide chromatin and expression profiling. Our results show that most active distal sites in these tumors are occupied by the transcription factor OTX2. Highly active OTX2-bound enhancers are often arranged as clusters of adjacent peaks and are also bound by the transcription factor NEUROD1. These sites are responsive to OTX2 and NEUROD1 knockdown and could also be generated de novo upon ectopic OTX2 expression in primary cells, showing that OTX2 cooperates with NEUROD1 and plays a major role in maintaining and possibly establishing regulatory elements as a pioneer factor. Among OTX2 target genes, we identified the kinase NEK2, whose knockdown and pharmacologic inhibition decreased cell viability. Our studies thus show that OTX2 controls the regulatory landscape of Group 3 medulloblastoma through cooperative activity at enhancer elements and contributes to the expression of critical target genes.Significance: The gene regulation mechanisms that drive medulloblastoma are not well understood. Using chromatin profiling, we find that the transcription factor OTX2 acts as a pioneer factor and, in cooperation with NEUROD1, controls the Group 3 medulloblastoma active enhancer landscape. OTX2 itself or its target genes, including the mitotic kinase NEK2, represent attractive targets for future therapies. Cancer Discov; 7(3); 288-301. ©2017 AACR.This article is highlighted in the In This Issue feature, p. 235.


Figures

Figure 1
Figure 1. The majority of active enhancers shared by primary Group 3 medulloblastomas are bound by the transcription factor OTX2
A. Identification of a set of 9621 shared active enhancers in primary Group 3 medulloblastoma tumors. Heatmaps depict H3K27ac (green) and H3K4me1 (blue) ChIP-seq signals in 5 frozen primary medulloblastoma tumors. Similar chromatin signals are found in two Group 3 cell lines (D341 and D283). Each row shows a 10 kb region centered on the active enhancer coordinates, ranked by average H3K27ac signals. B. Two examples of the set of active enhancers shared by Group 3 medulloblastoma tumors. H3K27ac ChIP-seq signals are shown in green and consistently active regions are marked in light gray. C. Genes associated with the Group 3 active enhancer set are expressed at higher levels in primary tumors and in the D341 cell line. Boxplot of RNA-seq FPKM expression values for genes closest to Group 3 active enhancers (red) compared to other loci (blue). *** Indicates p value < 1e-20. D. Motif analysis of the active Group 3 enhancer set. OTX2 has the highest enrichment. E. The OTX2 locus is highly active in primary tumors and cell lines and also contains several OTX2 peaks. H3K27ac ChIP-seq signals are shown in green. OTX2 ChIP-seq in D341 is shown in purple. F. OTX2 is primarily localized at putative enhancer sites in Group 3 medulloblastoma cell lines. Pie chart showing OTX2 peaks annotated using the Refseq promoter database and H3K4me3 ChIP-seq data. G. OTX2 is present at the majority of Group 3 active enhancers defined in primary tumors. The chart represents OTX2 ChIP-seq signals overlapping the genomic coordinates of the active Group 3 enhancer set. The color scale represents log2 ChIP-seq signals. Endogenous OTX2 was profiled in two Group 3 cell lines using two different antibodies.
Figure 2
Figure 2. OTX2 is associated with higher levels of activity when paired with NEUROD1 and arranged in clusters
A. OTX2 bound distal sites show a wide range of H3K27ac levels. Heatmaps depicting OTX2 ChIP-seq (purple) in cell lines and H3K27ac ChIP-seq (green) in cell lines and tumors. Sites where OTX2 is arranged as clusters of at least three peaks are marked. Rows are ordered by the average H3K27ac levels in cell lines and tumors and show a 10 kb region centered on each OTX2 binding site. Two categories of sites are shown: consistently Active sites (top; n=7053) and consistently Inactive sites (bottom; n=5751). B. One example of each category of OTX2 binding sites in D341 cell line: Active site (top) Inactive site (bottom). OTX2 ChIP-seq signals are shown in purple and H3K27ac ChIP-seq signals are shown in green. C. OTX2 enhancer activity is linked to higher gene expression levels in medulloblastoma primary tumors and D341 medulloblastoma cells. FPKM levels of the closest genes in each category of OTX2 peak: Active (green) and Inactive (yellow). *** Indicates p value < 1e-20. D. NEUROD1 is enriched at active OTX2 sites. Top: Motif analysis comparing Active vs Inactive OTX2 binding sites shows that the NEUROD1 motif is the most highly enriched in Active sites. Bottom: Boxplot of endogenous NEUROD1 ChIP-seq signal intensities shows higher levels of NEUROD1 on Active (green) OTX2 sites compared to Inactive sites (yellow) in D341 cells. *** Indicates p value < 1e-20. E. OTX2 and NEUROD1 are part of the same endogenous protein complexes in medulloblastoma cells. Co-immunoprecipitation experiments in D341 nuclear extracts (NE) show an interaction between OTX2 and NEUROD1. NEUROD1 signals are detected after OTX2 immunoprecipitation (top) and reciprocal experiments show OTX2 signals after NEUROD1 immmunoprecipitation (bottom). * indicates signals for IgG Heavy chains used for immunoprecipitation. F. NEUROD1 signals on OTX2 binding sites are associated with higher levels of enhancer activity. Boxplot showing H3K27ac ChIP-seq signal levels on OTX2 peaks categorized by NEUROD1 ChIP-seq signal levels in D341 cells. *** Indicates p value < 1e-20. G. OTX2 binds as clusters of peaks on Active enhancers. Histograms show the number of OTX2 peaks identified in a 5 kb window around each OTX2 peak in Active (Left) and Inactive distal sites (Right). H. OTX2 peak clusters have higher levels of enhancer activity. Boxplots show H3K27ac (green) and OTX2 (purple) ChIP-seq levels on OTX2 binding sites according to the number of neighboring OTX2 peaks. *** Indicates p value < 1e-20.
Figure 3
Figure 3. OTX2 maintains enhancer activity in Group 3 medulloblastoma and can operate as a pioneer factor in primary cells
A. OTX2 is required to maintain marks of enhancer activity in D341 medulloblastoma cells. Top: A heatmap shows changes in H3K27ac ChIP-seq at distal sites with decreased OTX2 binding following knockdown with lentiviral shRNA (19513 sites are shown). Bottom: Immunoblotting for OTX2 in the two D341 knockdown experiments shows decreases in OTX2 protein levels. B. Depletion of OTX2 has a strong effect on chromatin states of Active OTX2 sites compared to Inactive sites. Histograms show changes in H3K27ac at sites with decreased OTX2 after infection of D341 medulloblastoma cells with shRNA lentiviruses. Top: H3K27ac decreases in Active sites after OTX2 depletion (n=2649). Bottom: Inactive sites are mostly unaffected by OTX2 depletion (n=2240). The red line indicates no variation; blue bars correspond to more than two-fold decrease and red bars to more than two-fold increase. C. Examples of ChIP-seq tracks of H3K27ac on Active and Inactive OTX2 distal sites following OTX2 knockdown in D341 medulloblastoma cells. OTX2 is shown in purple and H3K27ac in green. Regions of interest are shown in light gray. D. Depletion of NEUROD1 affects chromatin states at OTX2 bound enhancers. Left: NEUROD1 immunoblotting in D341 knockdown experiments. Right: Histogram plot showing H3K27ac ChIP-seq changes at OTX2 distal sites with decreased NEUROD1 after infection of D341 medulloblastoma cells with lentiviral shRNA (3377 sites are shown). The red line indicates no variation; blue bars correspond to more than two-fold decrease and red bars to more than two-fold increase. E. Expression of ectopic OTX2 in primary mesenchymal stem cells (MSCs). Top: OTX2 protein is detected in MSCs after lentiviral infection. Bottom: Immunofluorescence demonstrates the absence of OTX2 signals in control cells and the presence of nuclear signals after introduction of ectopic OTX2 in MSCs (72 hours post-infection). F. OTX2 creates medulloblastoma enhancers de novo in MSCs. Heatmaps depict OTX2 (purple), H3K4me1 (blue) and H3K27ac (green) ChIP-seq signals as well as ATAC-seq (black) on 12286 de novo enhancers 72 hours after OTX2 expression in MSCs. Each row shows a 10 kb region centered on OTX2 binding sites in medulloblastoma. G. Examples of OTX2 induced de novo enhancer creation in MSCs. OTX2 (purple), H3K4me1 (blue) and H3K27ac (green) ChIP-seq as well as ATAC-seq (black). Regions of interest are shown in light gray. H. OTX2 interacts with chromatin modifying complexes associated with enhancer chromatin states. Co-immunoprecipitation experiments were performed in D341 nuclear extracts and show interactions with components involved in chromatin opening (SMARCA4, SMARCA2, SMARCC1), and deposition of the enhancer marks H3K4me1 (UTX, ASH2) and H3K27ac (p300).
Figure 4
Figure 4. OTX2 dependent enhancer activity is associated with changes in the expression of target genes, including the mitotic kinase NEK2
A. Genes close to OTX2 distal sites are sensitive to decreased OTX2 expression. Boxplot comparing changes in H3K27ac at sites with decreases in OTX2 binding after shRNA depletion with changes in the expression of closest genes in D341 cells. H3K27ac decreases are associated with reductions in expression of target genes. The effect is most evident in OTX2 Active sites (p-value= 5.65e-12 for Wilcoxon rank test between the first and fourth intervals). B. Identification of a set of highly OTX2 responsive genes through integration of epigenomic and expression profiles. Heatmaps show significant chromatin changes and significant decreases in expression in genes regulated by OTX2 bound distal elements (FDR q-value=0.2). Left: H3K27ac changes at distal sites in two experiments (n=1347 OTX2 enhancers). Right: Z scores of gene expression levels in matching genes for two control (shGFP) and two OTX2 shRNA depletion experiments (n=510 genes). C. Chromatin states at the NEK2 locus. ChIP-seq tracks showing OTX2 (purple), H3K4me1 (blue), H3K4me3 (pink) and H3K27ac (green) in D341 cells. D. NEK2 expression is sensitive to OTX2 levels. RT-qPCR measuring NEK2 mRNA levels in D341 and D283 cell lines five days post-infection with lentiviral shRNAs targeting OTX2. ** Indicates p value < 0.01 and * Indicates p value < 0.05. E. NEK2 knockdown affects medulloblastoma cell growth. Cell viability assays 14 days post-infection in D341 and D283 cell lines with three specific shRNA targeting NEK2. ** Indicates p value < 0.01. F. Medulloblastoma cell lines are sensitive to NEK2 inhibition. Cell viability assays five days post-treatment with the indicated concentrations of NEK2 inhibitor JH-295 in the medulloblastoma cell lines D341 and D283 and the non-medulloblastoma cell lines U2OS and Hela.

References

    1. Ostrom QT, Gittleman H, Fulop J, Liu M, Blanda R, Kromer C, et al. CBTRUS Statistical Report: Primary Brain and Central Nervous System Tumors Diagnosed in the United States in 2008-2012. Neuro Oncol. 2015;17(Suppl 4):iv1–iv62. - PMC - PubMed
    1. Thompson MC, Fuller C, Hogg TL, Dalton J, Finkelstein D, Lau CC, et al. Genomics identifies medulloblastoma subgroups that are enriched for specific genetic alterations. J Clin Oncol. 2006;24:1924–31. - PubMed
    1. Kool M, Koster J, Bunt J, Hasselt NE, Lakeman A, van Sluis P, et al. Integrated genomics identifies five medulloblastoma subtypes with distinct genetic profiles, pathway signatures and clinicopathological features. PLoS One. 2008;3:e3088. - PMC - PubMed
    1. Cho YJ, Tsherniak A, Tamayo P, Santagata S, Ligon A, Greulich H, et al. Integrative genomic analysis of medulloblastoma identifies a molecular subgroup that drives poor clinical outcome. J Clin Oncol. 2011;29:1424–30. - PMC - PubMed
    1. Northcott PA, Korshunov A, Witt H, Hielscher T, Eberhart CG, Mack S, et al. Medulloblastoma comprises four distinct molecular variants. J Clin Oncol. 2011;29:1408–14. - PMC - PubMed

MeSH terms