. 2017 Mar 22;37(12):3215-3230.
doi: 10.1523/JNEUROSCI.2737-16.2017. Epub 2017 Feb 17.

Acetylcholine Release in Prefrontal Cortex Promotes Gamma Oscillations and Theta-Gamma Coupling during Cue Detection

Affiliations

Acetylcholine Release in Prefrontal Cortex Promotes Gamma Oscillations and Theta-Gamma Coupling during Cue Detection

William M Howe et al. J Neurosci. .

Abstract

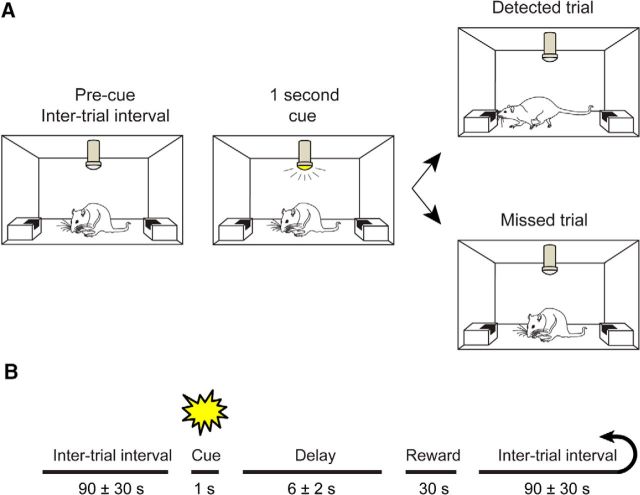
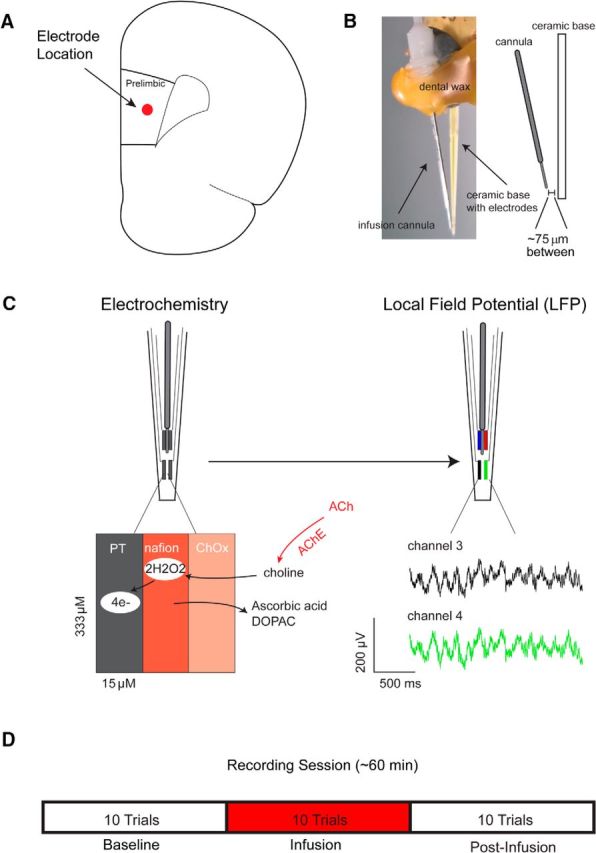
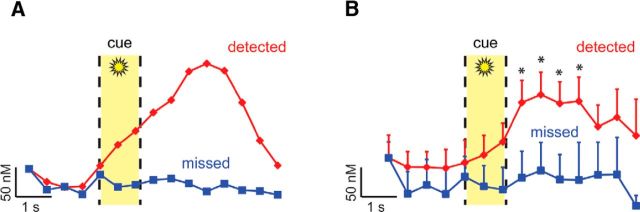
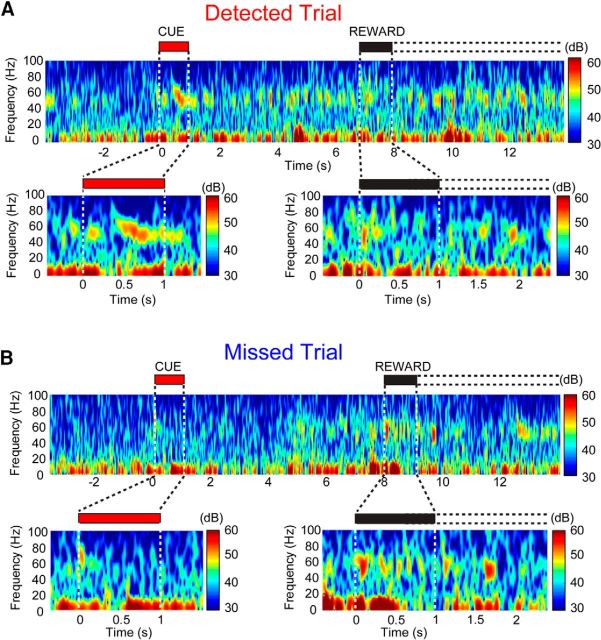
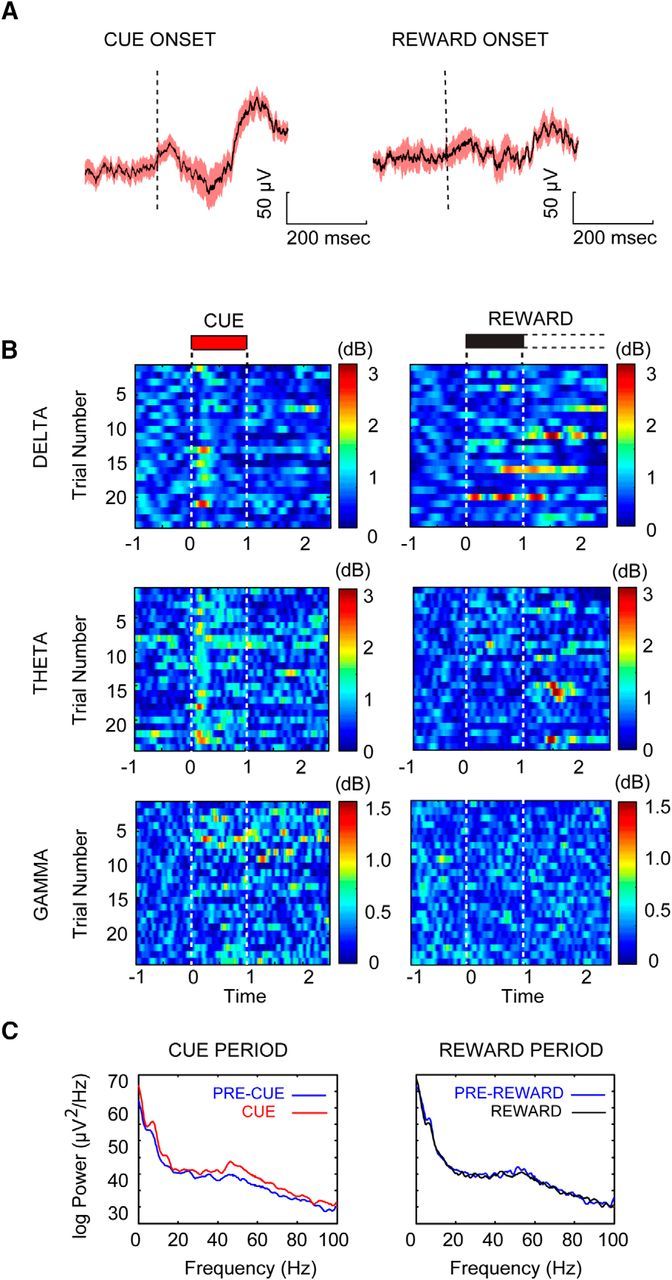
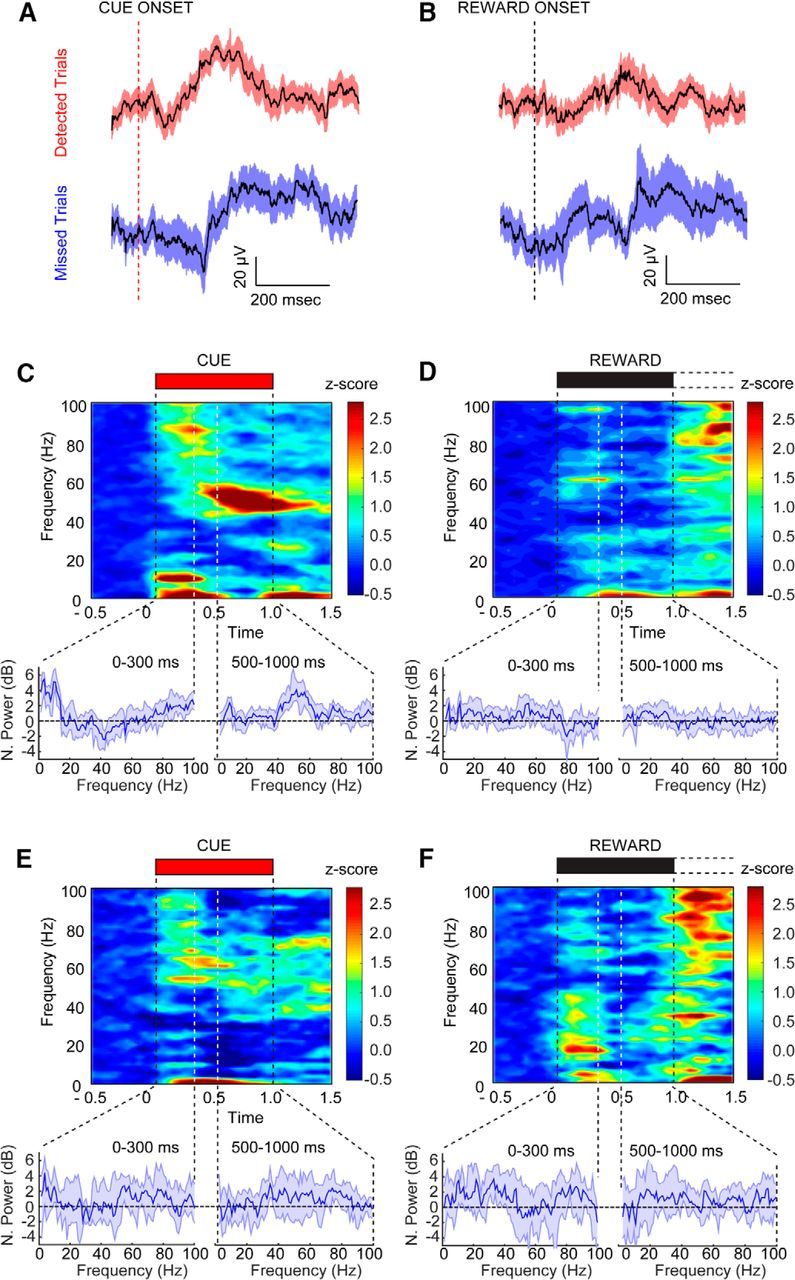
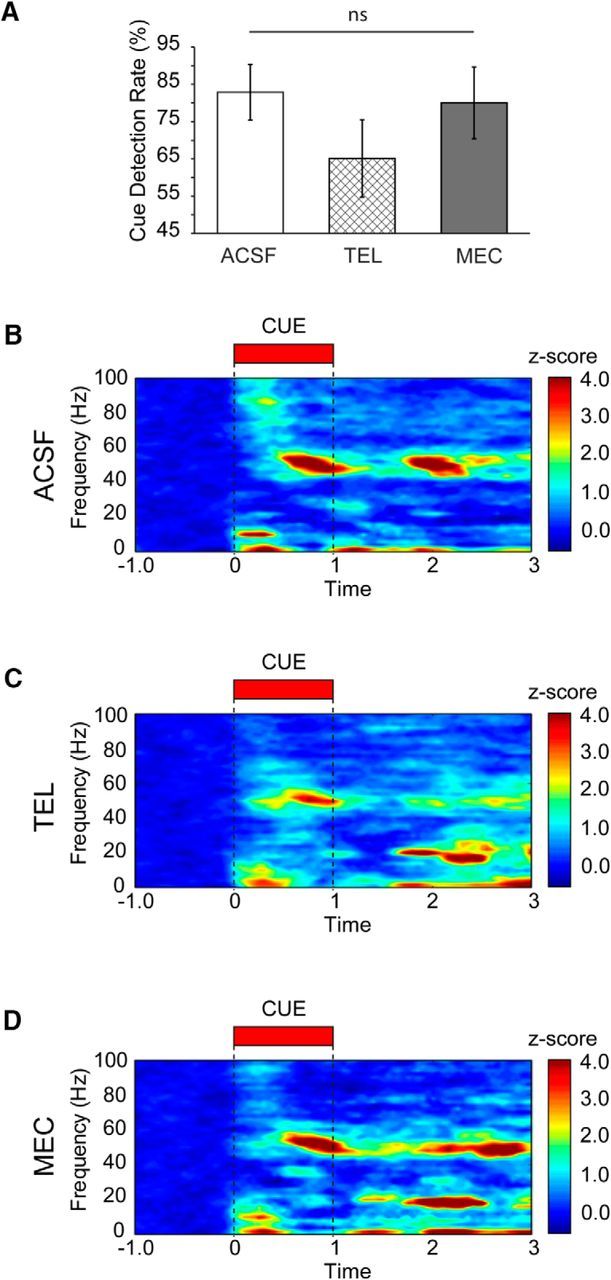
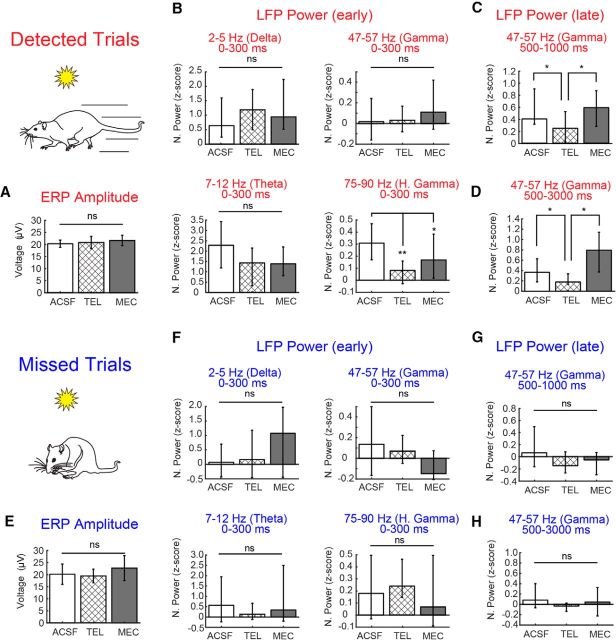
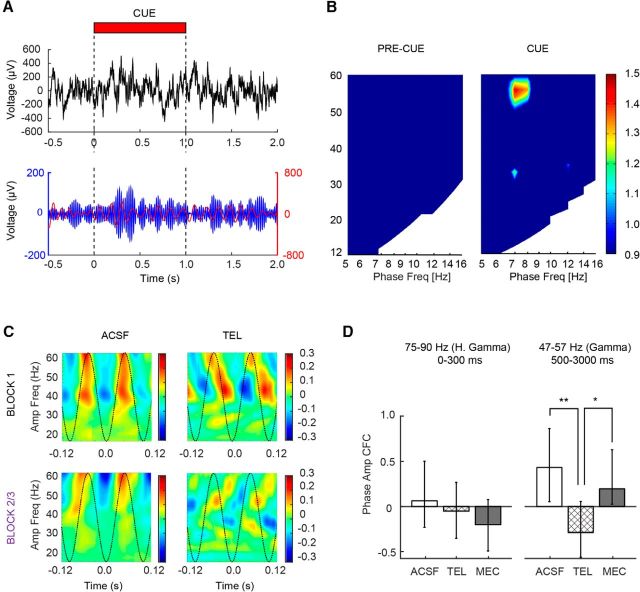
The capacity for using external cues to guide behavior ("cue detection") constitutes an essential aspect of attention and goal-directed behavior. The cortical cholinergic input system, via phasic increases in prefrontal acetylcholine release, plays an essential role in attention by mediating such cue detection. However, the relationship between cholinergic signaling during cue detection and neural activity dynamics in prefrontal networks remains unclear. Here we combined subsecond measures of cholinergic signaling, neurophysiological recordings, and cholinergic receptor blockade to delineate the cholinergic contributions to prefrontal oscillations during cue detection in rats. We first confirmed that detected cues evoke phasic acetylcholine release. These cholinergic signals were coincident with increased neuronal synchrony across several frequency bands and the emergence of theta-gamma coupling. Muscarinic and nicotinic cholinergic receptors both contributed specifically to gamma synchrony evoked by detected cues, but the effects of blocking the two receptor subtypes were dissociable. Blocking nicotinic receptors primarily attenuated high-gamma oscillations occurring during the earliest phases of the cue detection process, while muscarinic (M1) receptor activity was preferentially involved in the transition from high to low gamma power that followed and corresponded to the mobilization of networks involved in cue-guided decision making. Detected cues also promoted coupling between gamma and theta oscillations, and both nicotinic and muscarinic receptor activity contributed to this process. These results indicate that acetylcholine release coordinates neural oscillations during the process of cue detection.SIGNIFICANCE STATEMENT The capacity of learned cues to direct attention and guide responding ("cue detection") is a key component of goal-directed behavior. Rhythmic neural activity and increases in acetylcholine release in the prefrontal cortex contribute to this process; however, the relationship between these neuronal mechanisms is not well understood. Using a combination of in vivo neurochemistry, neurophysiology, and pharmacological methods, we demonstrate that cue-evoked acetylcholine release, through distinct actions at both nicotinic and muscarinic receptors, triggers a procession of neural oscillations that map onto the multiple stages of cue detection. Our data offer new insights into cholinergic function by revealing the temporally orchestrated changes in prefrontal network synchrony modulated by acetylcholine release during cue detection.

Keywords: acetylcholine; oscillations; prefrontal cortex.


Figures

Figure 1.
Figure 1.
Task description. A, B, Animals were trained to perform a cued appetitive response task. A 1 s illumination of a centrally located, overhead cue light (conditioned stimulus) predicted the later availability of reward (6 ± 2 s after cue). Reward was available for 30 s, but rewards were typically consumed within the first 1–2 s of availability. Animals were given 30 cue–reward pairings in a session, with trials separated by 90 ± 30 s.
Figure 2.
Figure 2.
Measurement scheme and experimental design. A, Platinum (PT) microelectrode arrays were implanted into the prelimbic subregion of right prefrontal cortex. B, Local microinfusions were delivered via a cannula connected to the microelectrode array, centered between the four platinum recording sites ∼75 μm from the recording surface. C, Left, For electrochemical recordings, platinum sites were coated with Nafion to control for the contribution of interferents to current signals. Changes in ACh release were measured by converting choline produced by the hydrolysis of newly released ACh to current on the electrode surface. Right, The same electrodes were used to monitor changes in the local field potential in separate sessions. The green and black traces below are representative local field potentials recorded from two electrodes on the same array. D, On drug test days, animals performed 10 baseline trials, followed by 10 trials during which drug (telenzepine, mecamylamine) or vehicle (ACSF) was infused (50 nl/min over 20 min) into the recording area while animals continued to perform the task. During the final 10 trials, no infusion occurred.
Figure 3.
Figure 3.
Confirmation of cue-evoked phasic ACh release when cues are detected, but not missed. Fixed-potential amperometry was used to measure choline currents in the right PFC of animals performing a cued appetitive response task (n = 2; field potentials were recorded using the same electrodes). A, Example of single trials showing changes in choline currents on a trial where the cue was detected (red) and a trial when the cue was missed (blue). For each trace, the first data point has been set to 0, and each subsequent point reflects the change in choline concentration from this point. The yellow shaded area represents the 1 s cue presentation window. B, Population average of choline currents observed during detected (29 trials) versus missed cues (11 trials). Choline currents began to rise with the onset of the cue, but only when such cues were detected. Currents reached their peak within seconds, and then began to decline before reward presentation 6 ± 2 s later. These results confirm our prior findings supporting a selective role for phasic ACh release in cue detection (Parikh et al., 2007; Howe et al., 2013). Error bars indicate SEM. *p < 0.05 versus precue choline concentrations.
Figure 4.
Figure 4.
Dissociation of detected and missed cues in the local field potential. A, B, Top, Changes in spectral activity from individual detected and missed cue trials for a representative animal. Spectrograms from a single detected trial (A) and a missed trial (B) from the same recording session are shown, with the cue and reward periods magnified below, noted by the red and black bars, respectively. The first second after reward delivery is shaded black, with the dashed lines representing the reward availability window. The color scale to the right indicates amplitude. When cues were detected, we noted a prominent increase in high-frequency power, particularly in gamma frequency ranges (e.g., >30 Hz), that persisted for several seconds and was reliably observed across individual trials. Changes in LFP power coincided with cue detection in lower-frequency bands (<20 Hz) with different temporal profiles (A). Such changes high-frequency power were not apparent when cues were missed (B), or when reward was presented on either trial type.
Figure 5.
Figure 5.
Detected cues modulate power in select frequency bands. A, Averaged cue-triggered LFP aligned to cue and reward onset across trials from a single session in a single animal. B, Bandpass-filtered Hilbert-transformed LFP color plots for all detected trials (n = 24) for the cue and reward periods from a single session. Plots illustrate the three frequency bands that showed significant changes coincident with cue detection: delta (2–5 Hz), theta (7–12 Hz), and gamma (47–57 Hz). C, FFT power spectrum from all trials shown in B for the 1 s cue period (left, red) plotted in comparison to power in the 1 s window before cue (blue). The reward period is shown on the right with the FFT power representing the first second of available reward (black) compared to the 1 s prereward period (blue). Power has been Z-score normalized to the precue period.
Figure 6.
Figure 6.
Cue detection is represented by oscillations in the LFP. A, B, Cue- and reward-triggered changes in the LFP from detected (n = 7 animals, 63 trials) and missed trials (n = 24 trials) in blocks 2 and 3 for all ACSF-infused animals. Broad-spectrum LFPs did not differ substantially on detected and missed trials. C–F, Cue- and reward-triggered changes in neural oscillations from the same trials. The power spectrum from the highlighted period above is shown below each spectrogram. The left spectrum represents time points 0–300 ms after cue, and the right spectrum represents time points 500–1000 ms after cue. C, Spectrogram for the cue window when such cues were detected. Detected cues selectively evoked increases in delta, theta, and high gamma oscillations in the early phase of cue presentation, and sustained low gamma oscillations in the late phase. D, Population spectrogram from the reward-presentation period for the detected trials shown in C with the corresponding spectrum below. E, Cue-triggered population spectrogram for missed trials. Missed cues were associated with increased theta and high gamma power but lacked the low gamma power increases during the late phase of cue presentation. F, Reward-triggered population spectrogram corresponding to the same trials shown in E. Power was Z-score normalized to the 1 s before cue/reward. Error bars represent the 95% confidence intervals for the median Z-scored power.
Figure 7.
Figure 7.
Cholinergic antagonist effects on performance and oscillations promoted by detected cues. A, Detection rates (mean ± SEM) during the infusion and postinfusion blocks separated by drug type. B, Cue-triggered population spectrogram from detected trials for all animals during the infusion and postinfusion periods (n = 7 animals, 63 trials). An increase in gamma, theta, and delta power is present following infusion of vehicle (ACSF). C, Cue-triggered population spectrogram from all detected trials during the infusion and postinfusion periods (n = 9 animals, 94 trials) for telenzepine (TEL). Telenzepine reduced early high gamma power as well as the sustained increase in gamma power that persisted to the reward period. D, Cue-triggered population spectrogram from all detected trials during the infusion and postinfusion periods (n = 8 animals, 93 trials) for mecamylamine (MEC). Mecamylamine reduces high-frequency gamma at cue onset but has no influence on low gamma, theta, or delta power. Power has been Z-score normalized to the precue period for all spectograms.
Figure 8.
Figure 8.
Bar plots quantifying the reduction in power shown in the population spectrograms across the three frequency ranges during cue presentation on detected and missed trials. A, ERP amplitude associated with the visual cue was not influenced by local cholinergic receptor antagonism. B, During the first 300 ms of cue presentation on detected trials, power in the high gamma frequency was reduced by both the mAChR (M1) antagonist telenzepine (TEL) and the nAChR receptor antagonist mecamylamine (MEC). C, D, Normalized gamma power during the late phase of the cue window (C; 500–1000ms) and the 2 s following the cue and before reward delivery (D; 500–3000ms) was selectively reduced by telenzepine. E–H, Effects of cue presentation on ERP amplitude (E) and LFP power (F–H) on missed trials. Missed cues lacked the robust changes in high and low gamma power seen during detected cues. Neither cholinergic receptor antagonist affected the residual power observed in these frequency ranges. Error bars represent the 95% confidence intervals for the median Z-scored power. *p < 0.05; **p < 0.01.
Figure 9.
Figure 9.
Gamma and theta exhibit phase–amplitude cross-frequency coupling following detected cues. A, Single trial example of raw LFP (top) and bandpass-filtered LFP for theta (red) and gamma (blue). Note the increase in gamma power is phase aligned at theta peaks beginning ∼500 ms into cue presentation and extends into the delay period before reward delivery. B, Population CFC comodulograms from the precue (left) and late cue/postcue periods (500–3000 ms; right) for all ACSF-infused animals during the infusion and postinfusion blocks (n = 7 animals, 63 trials). CFC coupling in the postcue window was normalized to the precue CFC shown on the left. C, Illustration of the capacity of telenzepine (TEL) to potently disrupt the CFC phase relationship between gamma and theta during cue presentation and reward retrieval. Individual phase–amplitude plots from a representative animal showing gamma power modulation as a function of theta phase from the preinfusion (block 1; top) and postinfusions (block 2/3; bottom) periods in the presence of ACSF (left) and telenzepine (right). D, Population histogram showing median precue subtracted theta–gamma CFC strength of coupling following infusion. Coupling strength for high gamma–theta in the first 300 ms is shown on the left, and low gamma–theta is shown on the right. Note gamma–theta CFC coupling was specific to the low gamma range during the late phase of cue detection. Error bars reflect bootstrapped 95% confidence intervals. *p < 0.05; **p < 0.01.

References

    1. Arnold HM, Burk JA, Hodgson EM, Sarter M, Bruno JP (2002) Differential cortical acetylcholine release in rats performing a sustained attention task versus behavioral control tasks that do not explicitly tax attention. Neuroscience 114:451–460. 10.1016/S0306-4522(02)00292-0 - DOI - PubMed
    1. Axmacher N, Henseler MM, Jensen O, Weinreich I, Elger CE, Fell J (2010) Cross-frequency coupling supports multi-item working memory in the human hippocampus. Proc Natl Acad Sci U S A 107:3228–3233. 10.1073/pnas.0911531107 - DOI - PMC - PubMed
    1. Bichot NP, Rossi AF, Desimone R (2005) Parallel and serial neural mechanisms for visual search in macaque area V4. Science 308:529–534. 10.1126/science.1109676 - DOI - PubMed
    1. Bland BH, Oddie SD (2001) Theta band oscillation and synchrony in the hippocampal formation and associated structures: the case for its role in sensorimotor integration. Behav Brain Res 127:119–136. 10.1016/S0166-4328(01)00358-8 - DOI - PubMed
    1. Bokil H, Andrews P, Kulkarni JE, Mehta S, Mitra PP (2010) Chronux: a platform for analyzing neural signals. J Neurosci Methods 192:146–151. 10.1016/j.jneumeth.2010.06.020 - DOI - PMC - PubMed