. 2017 Apr 1;198(7):2906-2915.
doi: 10.4049/jimmunol.1601781. Epub 2017 Feb 17.

Inhibition of Inflammatory Gene Transcription by IL-10 Is Associated with Rapid Suppression of Lipopolysaccharide-Induced Enhancer Activation

Affiliations

Inhibition of Inflammatory Gene Transcription by IL-10 Is Associated with Rapid Suppression of Lipopolysaccharide-Induced Enhancer Activation

Evan A Conaway et al. J Immunol. .

Abstract

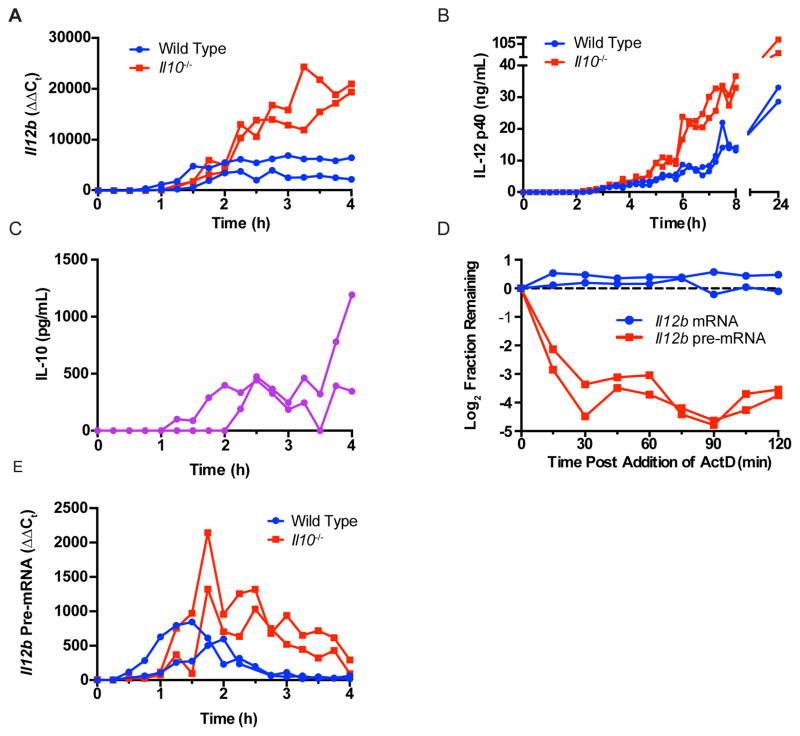
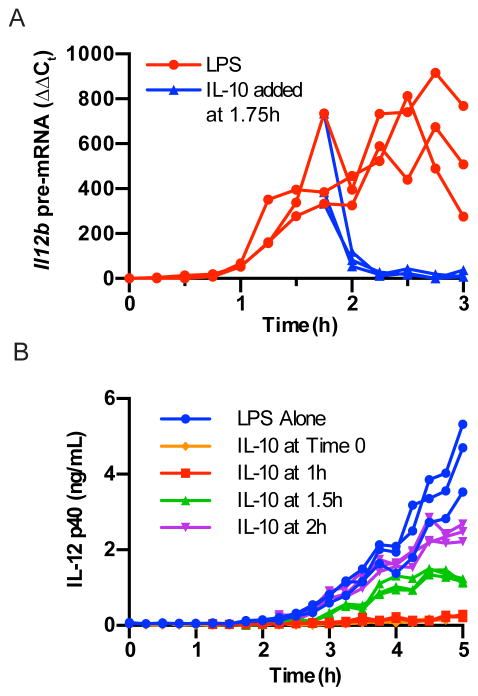
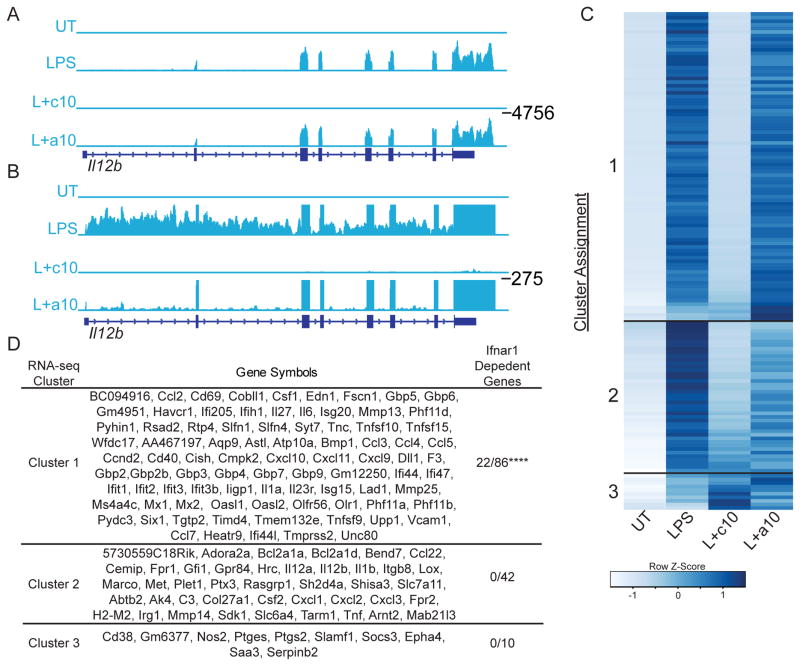
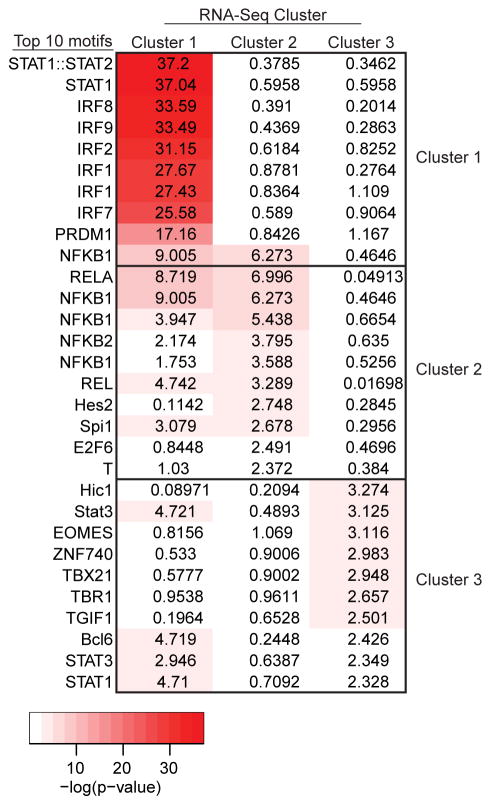
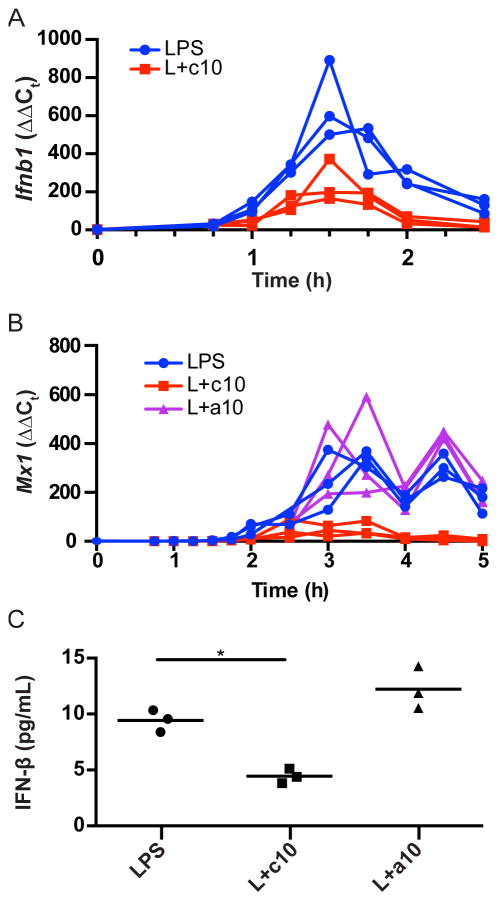
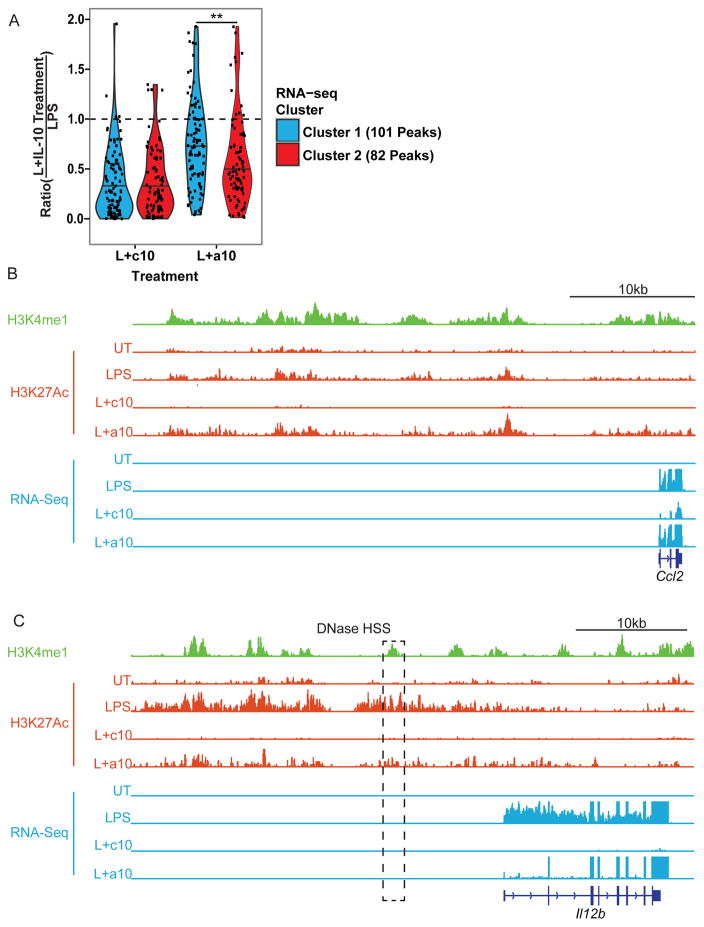
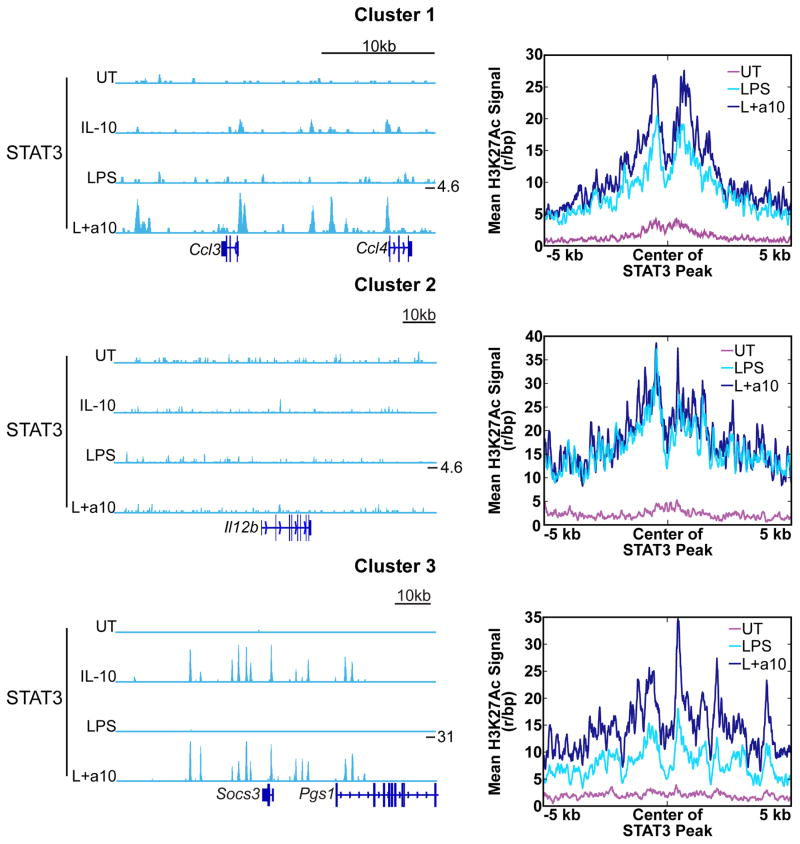
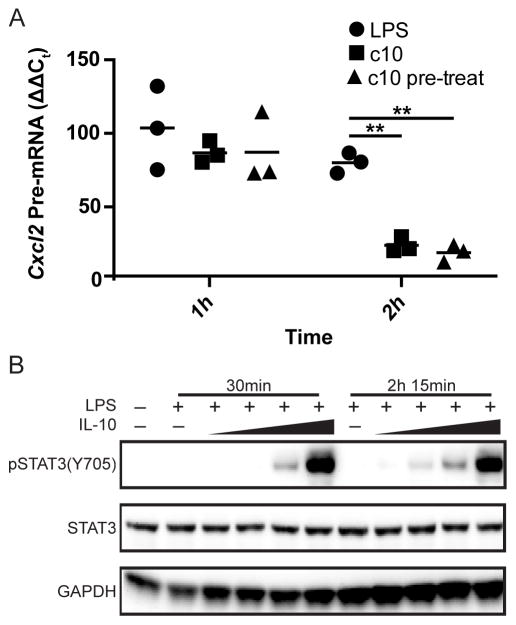
IL-10 limits the magnitude of inflammatory gene expression following microbial stimuli and is essential to prevent inflammatory disease; however, the molecular basis for IL-10-mediated inhibition remains elusive. Using a genome-wide approach, we demonstrate that inhibition of transcription is the primary mechanism for IL-10-mediated suppression in LPS-stimulated macrophages and that inhibited genes can be divided into two clusters. Genes in the first cluster are inhibited only if IL-10 is included early in the course of LPS stimulation and is strongly enriched for IFN-inducible genes. Genes in the second cluster can be rapidly suppressed by IL-10 even after transcription is initiated, and this is associated with suppression of LPS-induced enhancer activation. Interestingly, the ability of IL-10 to rapidly suppress active transcription exhibits a delay following LPS stimulation. Thus, a key pathway for IL-10-mediated suppression involves rapid inhibition of enhancer function during the secondary phase of the response to LPS.


Figures

Figure 1
Figure 1. IL-10 rapidly inhibits Il12b transcription
(A) WT and Il10−/− BMDM were stimulated with LPS (1 ng/mL). RNA was harvested every 15 min for 4 h. Il12b mRNA was measured by RT-PCR and expression levels displayed relative to unstimulated levels using the ΔΔCt method (n=2). (B) WT and Il10−/− BMDM were stimulated with LPS and supernatants collected every 15 min up to 8 h as well as at 24 h. IL-12 p40 levels were measured by ELISA (n=2). (C) IL-10 levels in supernatants of WT BMDM were measured by ELISA (n = 2). (D) Actinomycin D (5 μg/mL) was added to WT BMDM 2 h after LPS stimulation, and RNA was harvested every 15 min for the ensuing 2 h. Il12b mRNA and pre-mRNA were measured by RT-PCR and displayed as the log2 fraction remaining compared to the time of actinomycin D addition (n=2). (E) Il12b pre-mRNA was measured by RT-PCR in RNA harvested from WT and Il10−/− BMDM, and displayed relative to the unstimulated levels (n=2). All experiments displayed in this figure were performed twice.
Figure 2
Figure 2. Exogenous IL-10 rapidly inhibits Il12b transcription
(a) Il10−/− BMDM were stimulated with LPS and then treated with IL-10 (1 ng/ml) at 1.75 hours or left untreated. RNA was collected every 15 min and Il12b pre-mRNA was measured by RT-PCR (n=3). This experiment was performed three times. (b) Il10−/− BMDM were stimulated with LPS with or without the addition of IL-10 at the indicated time points. IL-12 p40 levels in the supernatants were measured by ELISA every 15 min (n=3). This experiment was performed once.
Figure 3
Figure 3. Global modulation of LPS-induced gene expression by IL-10
Il10−/− BMDM were left untreated (UT), stimulated with LPS for 3.25 h (LPS), stimulated with LPS and IL-10 together for 3.25 h (L+c10), or stimulated with LPS for 3.25 h with the addition of IL-10 for the last 30 min of the stimulation (L+a10). Total RNA was harvested and sequenced following ribosomal depletion. (A) Normalized distribution of RNA-seq reads is shown at the Il12b locus, and (B) with an expanded y-axis to better demonstrate pre-mRNA. (C) Heatmap showing k-means clustering of pre-mRNA signal for the 138 genes induced 100-fold by LPS in Il10−/− BMDM. (D) Individual genes that comprise each cluster, and the number of genes in each cluster deemed Ifnar1-dependent in Tong et al. (4). Fisher’s exact test was used to calculate significant differences. **** indicates p < 0.0001.
Figure 4
Figure 4. Transcription factor binding motifs in LPS-induced promoters
PSCAN analysis of promoters for LPS induced genes clustered as in Fig. 3C. The top 10 motifs for each cluster are shown on the left. Columns represent enrichment p-values for each motif organized by cluster (top). The color intensity is proportional to the negative log of the p value.
Figure 5
Figure 5. IL-10 inhibits IFN-β production
(A) Il10−/− BMDM were stimulated with LPS (LPS) or with LPS and IL-10 (L+c10). RNA was harvested at the indicated time points and Ifnb1 mRNA measured by RT-PCR (n=3). This experiment was performed three times. (B) Il10−/− BMDM were stimulated with LPS (LPS), stimulated with LPS and IL-10 (L+c10), or stimulated with LPS with the addition of IL-10 2 h after LPS stimulation (L+a10). RNA was harvested at the time points indicated and Mx1 mRNA was measured by RT-PCR (n=3). This experiment was performed three times. (C) Il10−/− BMDM were stimulated with LPS for 4 h (LPS), simulated with LPS and IL-10 for 4 h (L+c10), or stimulated with LPS for 4 h with with addition of IL-10 for the last 2 h (L+a10). Culture supernatants were harvested and analyzed for IFN-β protein secretion by ELISA. Significance was tested by ANOVA with Dunnett’s multiple comparisons test (n=3). * indicates p <0.05. This experiment was performed once.
Figure 6
Figure 6. IL-10 causes rapid changes in enhancer H3K27Ac status
Il10−/− BMDM were left untreated (UT), stimulated with LPS for 3.25 h (LPS), stimulated with LPS and IL-10 together for 3.25 h (L+c10), or stimulated with LPS for 3.25 h with the addition of IL-10 for the last 30 min of the stimulation (L+a10). Chromatin was harvested and ChIP-seq was performed with an antibody specific for H3K27Ac. (A) The H3K27Ac signal intensity was determined for each LPS induced acetylation peak within 50 kb upstream or downstream of Cluster 1 and Cluster 2 genes, and a ratio between the signal with LPS alone and with continuous or acute IL-10 treatment was calculated for each peak. These ratios are represented on a violin plot where each dot represents an individual enhancer and the width of the contours represent a smoothened density of these values. The horizontal line within each violin plot indicates the median value. Significance tested for by the Mann-Whitney test. ** indicates p < 0.01. (B–C) Representative locus shown for Cluster 1 gene ccl2 (B) and Cluster 2 gene Il12b (C). H3K4me1 ChIP-seq data from Ostuni et al. normalized to reads per million (green) (8). H3K27Ac ChIP-seq data from macrophages treated as in Fig. 6A normalized to the depth of the least sequenced library (red). Normalized RNA-seq data from macrophages treated as in Fig. 3C (blue). The boxed region in (C) represents the Il12b -10 kb enhancer previously described in Zhou et al. (22).
Figure 7
Figure 7. STAT3 binding is associated with gene induction
Left, Il10−/− BMDM were left untreated (UT), stimulated with IL-10 for 30 min (IL-10), stimulated with LPS for 3.25 h (LPS), or stimulated with LPS for 3.25 h with the addition of IL-10 for the last 30 min of the stimulation (LPS+a10). Chromatin was harvested and ChIP-seq performed for STAT3. STAT3 ChIP-seq signal in reads per million shown for representative locus for Cluster 1 genes Ccl3 and Ccl4 (top), Cluster 2 gene Il12b (middle), and a Cluster 3 gene Socs3 (bottom). Y-axis maximum for each locus marked in L+a10 track. Right, mean H3K27Ac Chip-Seq signal intensities from Il10−/− BMDM treated as in Fig. 6 for STAT3 peak centers identified within 50 kb upstream of genes in each cluster. Signal is normalized by library size to reads per base pair.
Figure 8
Figure 8. The ability of IL-10 to inhibit Cxcl2 transcription exhibits a delay following LPS stimulation
(A) Il10−/− BMDM were stimulated with LPS alone, treated with IL-10 concurrently with LPS stimulation, or pre-treated with IL-10 for 1 h prior to LPS stimulation. RNA was harvested at 1h and 2h after LPS stimulation. Cxcl2 pre-mRNA levels were measured by RT-PCR and displayed relative to levels in unstimulated cells. Significance was tested by 2-way ANOVA with Tukey’s multiple comparisons test (n=3). ** indicates p <0.01. This experiment was performed three times. (B) Il10−/− BMDM were stimulated with LPS for 30 min and 2.25 h with or without the addition of IL-10 in increasing doses of 0.0625 ng/mL, 0.25 ng/mL, 1 ng/mL, and 4 ng/mL for the last 30 min of the time course. Cell extracts were prepared and assayed for pSTAT3 (Y705) or total STAT3 by western blot. This experiment was performed twice.

References

    1. Amit I, Garber M, Chevrier N, Leite AP, Donner Y, Eisenhaure T, Guttman M, Grenier JK, Li W, Zuk O, Schubert LA, Birditt B, Shay T, Goren A, Zhang X, Smith Z, Deering R, McDonald RC, Cabili M, Bernstein BE, Rinn JL, Meissner A, Root DE, Hacohen N, Regev A. Unbiased Reconstruction of a Mammalian Transcriptional Network Mediating Pathogen Responses. Science. 2009;326:257–263. - PMC - PubMed
    1. Bhatt DM, Pandya-Jones A, Tong AJ, Barozzi I, Lissner MM, Natoli G, Black DL, Smale ST. Transcript dynamics of proinflammatory genes revealed by sequence analysis of subcellular RNA fractions. Cell. 2012;150:279–290. - PMC - PubMed
    1. Hargreaves DC, Horng T, Medzhitov R. Control of Inducible Gene Expression by Signal-Dependent Transcriptional Elongation. Cell. 2009;138:129–145. - PMC - PubMed
    1. Tong AJ, Liu X, Thomas BJ, Lissner MM, Baker MR, Senagolage MD, Allred AL, Barish GD, Smale ST. A Stringent Systems Approach Uncovers Gene-Specific Mechanisms Regulating Inflammation. Cell. 2016;165:165–179. - PMC - PubMed
    1. Doyle SE, Vaidya SA, O’Connell R, Dadgostar H, Dempsey PW, Wu TT, Rao G, Sun R, Haberland ME, Modlin RL, Cheng G. IRF3 Mediates a TLR3/TLR4-Specific Antiviral Gene Program. Immunity. 2002;17:251–263. - PubMed

Publication types