. 2017 Feb 21;46(2):233-244.
doi: 10.1016/j.immuni.2017.01.005. Epub 2017 Feb 14.

A Relay Pathway between Arginine and Tryptophan Metabolism Confers Immunosuppressive Properties on Dendritic Cells

Affiliations

A Relay Pathway between Arginine and Tryptophan Metabolism Confers Immunosuppressive Properties on Dendritic Cells

Giada Mondanelli et al. Immunity. .

Abstract

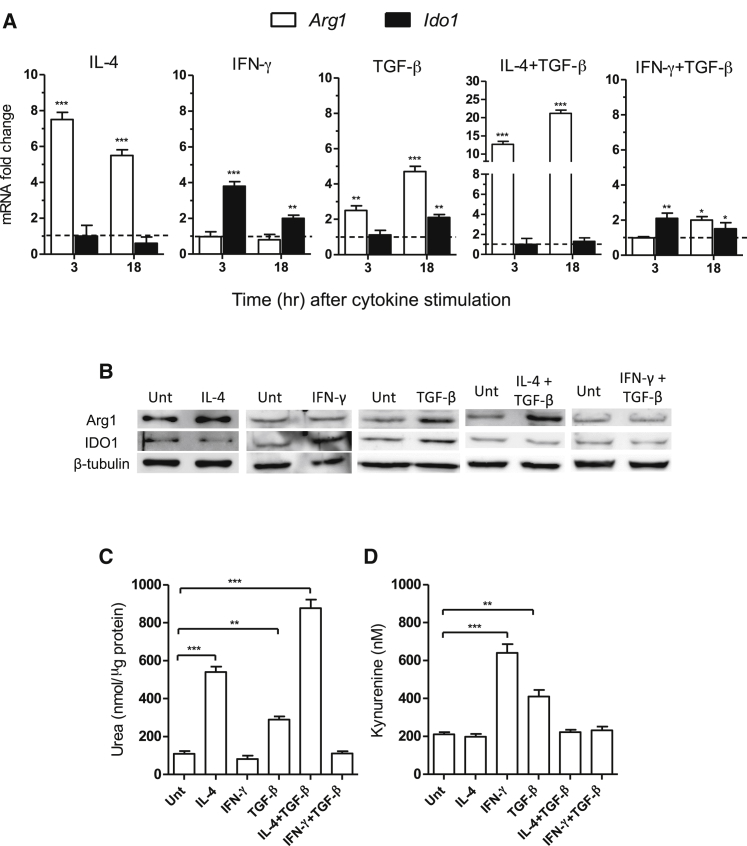
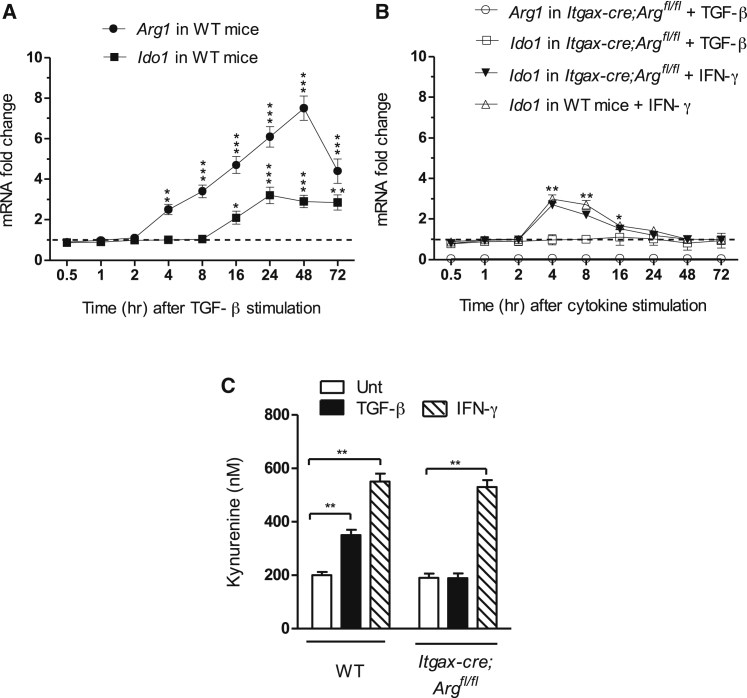
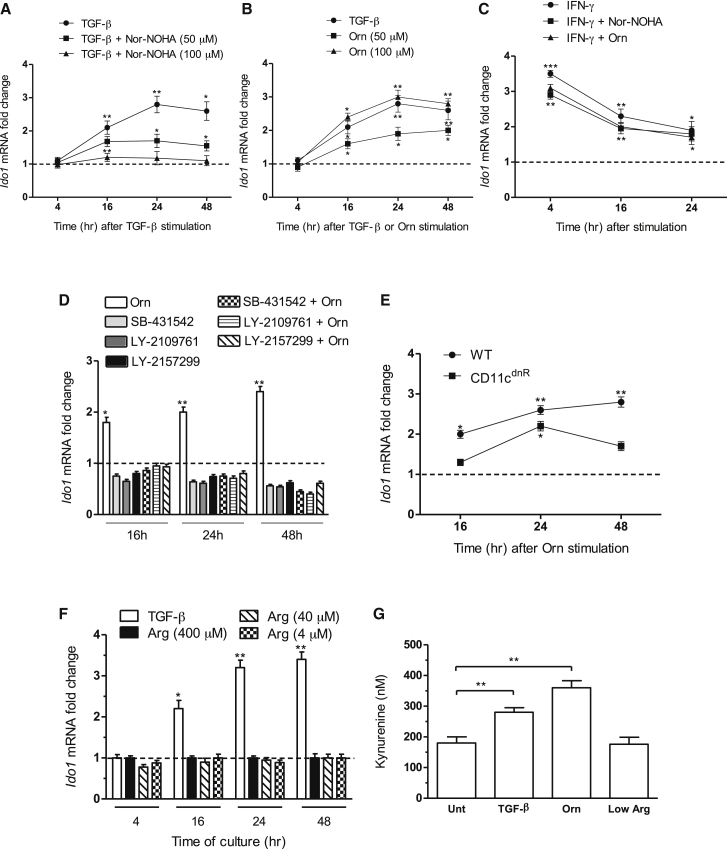
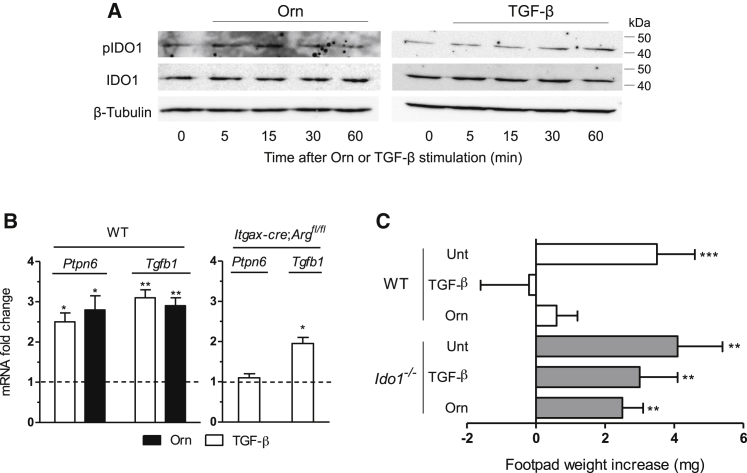
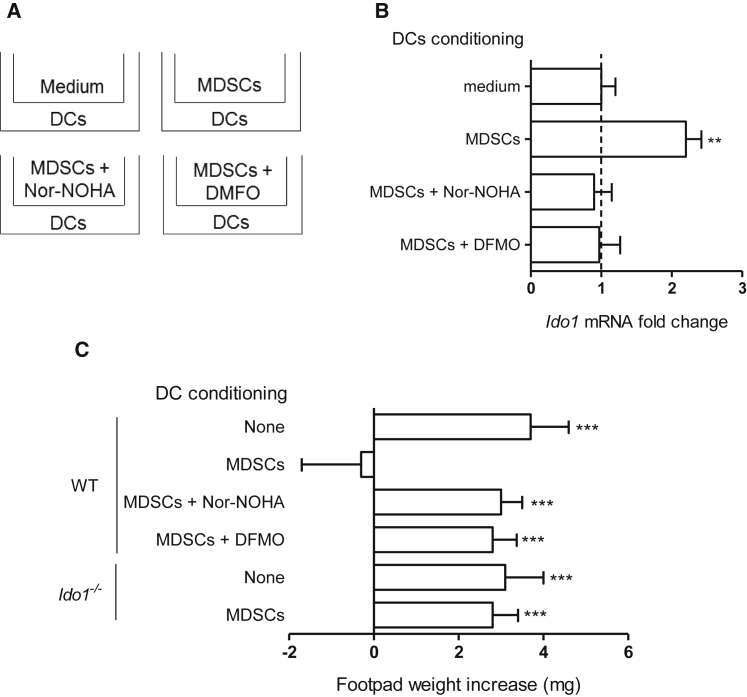
Arginase 1 (Arg1) and indoleamine 2,3-dioxygenase 1 (IDO1) are immunoregulatory enzymes catalyzing the degradation of l-arginine and l-tryptophan, respectively, resulting in local amino acid deprivation. In addition, unlike Arg1, IDO1 is also endowed with non-enzymatic signaling activity in dendritic cells (DCs). Despite considerable knowledge of their individual biology, no integrated functions of Arg1 and IDO1 have been reported yet. We found that IDO1 phosphorylation and consequent activation of IDO1 signaling in DCs was strictly dependent on prior expression of Arg1 and Arg1-dependent production of polyamines. Polyamines, either produced by DCs or released by bystander Arg1+ myeloid-derived suppressor cells, conditioned DCs toward an IDO1-dependent, immunosuppressive phenotype via activation of the Src kinase, which has IDO1-phosphorylating activity. Thus our data indicate that Arg1 and IDO1 are linked by an entwined pathway in immunometabolism and that their joint modulation could represent an important target for effective immunotherapy in several disease settings.

Keywords: Arg1; IDO1; TGF-β; amino acid metabolism; dendritic cell; immune regulation; ornithine; polyamine.


Figures

Figure 1
Figure 1
Arg1 and IDO1 Are Co-expressed in DCs Stimulated with TGF-β (A) Real-time PCR analysis of Arg1 and Ido1 transcripts in DCs stimulated for 3 or 18 hr with IL-4, IFN-γ, TGF-β, IL-4 plus TGF-β, or IFN-γ plus TGF-β normalized to the expression of Gapdh (encoding glyceraldehyde phosphate dehydrogenase) and presented relative to results in untreated cells (dotted line, 1-fold). (B) Arg1 and IDO1 immunoblot analysis of cell lysates from DCs incubated with IL-4, IFN-γ, TGF-β, IL-4 plus TGF-β, IFN-γ plus TGF-β, or medium alone (untreated, unt) for 24 hr. (C) Arg1 and (D) IDO1 activity measured in terms of urea in cell lysates and l-kynurenine in cell supernatants, respectively, of DCs incubated as in (B). p < 0.05; ∗∗p < 0.01; ∗∗∗p < 0.001 (Student’s t test; cytokine-treated versus untreated samples). All data are from one experiment representative of three (A–D; means ± SD of triplicates in A, C, and D).
Figure 2
Figure 2
Arg1 Expression Is Necessary for IDO1 Induction by TGF-β in DCs (A) Kinetic analysis of Arg1 and Ido1 transcripts in DCs from wild-type (WT) mice after incubation with TGF-β for different times (indicated). (B) Kinetic analysis of Ido1 and Arg1 transcripts in DCs from Itgax-cre;Argfl/fl animals prior to incubation with TGF-β or IFN-γ for different times. DCs from WT animals were used as control for IFN-γ stimulation. In (A) and (B), data are normalized and presented as in Figure 1A. (C) Kynurenine concentrations in supernatants of DCs from Itgax-cre;Arg1fl/fl and WT animals incubated with TGF-β, IFN-γ, or medium alone for 24 hr. p < 0.05; ∗∗p < 0.01; and ∗∗∗p < 0.001 (Student’s t test; cytokine-treated versus untreated samples). All data are from one experiment representative of three (means ± SD of triplicates). Please see also Figure S1.
Figure 3
Figure 3
Orn Induces IDO1 Expression and Activity in DCs Kinetic analysis of Ido1 transcripts in WT DCs stimulated with TGF-β (A and B), Orn (B and C), and/or IFN-γ (C) for different times (indicated) in the presence or absence of nor-NOHA (100 μM for IFN-γ), or medium with standard (i.e., 400 μM) or low (4–40 μM) Arg concentration (F). Kinetic analysis of Ido1 transcripts in WT (D, E) or CD11cdnR (E) DCs stimulated with Orn in the presence (D) or absence (E) of TGF-β receptor inhibitors. No toxic effects of inhibitors could be observed in DCs at the used concentration of 10 μM (data not shown). In (A)–(F), data are normalized and presented as in Figure 1A. (G) Kynurenine concentrations in supernatants of WT DCs stimulated with TGF-β in a standard medium (where not specified) or a medium with low Arg (4 μM), in the presence or absence of nor-NOHA (100 μM) or Orn (100 μM). p < 0.05; ∗∗p < 0.01; ∗∗∗p < 0.001 (stimulated samples versus untreated controls). All data are from one experiment representative of three (means ± SD of triplicates).
Figure 4
Figure 4
Orn Activates IDO1 Signaling and Confers IDO1-Dependent Immunosuppressive Properties in DCs (A) Immunoblot analysis of phosphorylated IDO1 (pIDO1) and total IDO1 in cell lysates of DCs incubated for different times with TGF-β or Orn (100 μM). (B) Real-time PCR analysis of Ptpn6 and Tgfb1 transcripts in WT DCs stimulated with TGF-β or Orn (100 μM) or in Itgax-cre;Argfl/fl DCs stimulated with TGF-β for 18 hr. Data are normalized and presented as in Figure 1A. p < 0.05 and ∗∗p < 0.01 (unpaired Student’s t test; cytokine- or Orn-treated versus untreated samples). (C) In vivo suppression of the activity of HY-pulsed WT CD8 DCs into WT recipient mice, in combination with a minority fraction (5%) of CD8 DCs from either WT or Ido1−/− mice with no conditioning (unt, untreated) or conditioned in vitro with TGF-β or Orn (100 μM) for 24 hr; analysis of skin reactivity of recipient mice to the eliciting peptide at 15 days is presented as change in footpad weight. ∗∗p < 0.01 and ∗∗∗p < 0.001 (paired Student’s t test; mean weight of experimental versus control footpads). Data are from one experiment representative of two (A) or three (B and C; means ± SD of triplicates in B and six samples in C).
Figure 5
Figure 5
Inhibition of Orn Decarboxylation Abrogates Orn Effects in DCs (A) Expression of Odc1 transcripts in sub-populations of DCs derived from different tissues. (B) Kinetic analysis of Ido1 transcripts in WT DCs stimulated with Orn (100 μM) in the presence or absence of 1 mM DFMO for different times (indicated). Data are normalized and presented as in Figure 1A. ∗∗p < 0.01 and ∗∗∗p < 0.001 (unpaired Student’s t test; Orn- or Orn plus DFMO-treated versus untreated samples). (C) In vivo suppression of the activity of HY-pulsed WT CD8 DCs in combination with a minority fraction (5%) of the same cells with no conditioning (untreated, unt) or conditioned in vitro with Orn as in Figure 4C in the presence or absence of DFMO (1 mM); analysis of skin reactivity is as in Figure 4C. ∗∗p < 0.01 and ∗∗∗p < 0.001 (paired Student’s t test as in Figure 4C). Data are from one experiment representative of three (B and C; means ± SD of triplicates in B and six samples in C; means ± SD of samples indicated in Table S3 for each DC subset in A). Please see also Figures S2 and S3.
Figure 6
Figure 6
Spermidine Activates IDO1 Immunosuppressive Signaling (A) Analysis of Arg and Trp metabolite profiles in culture supernatants from DCs incubated with Orn (100 μM) for 4 or 16 hr. Results are expressed in terms of heatmap, in which each square represents the fold change in mass to charge ratio mean value of the relative metabolite as compared to time 0. Annotated targeted metabolites were derived from nontarget raw date and only represent signals of established chemical identities with 5 ppm. (B) Real-time PCR analysis of Ido1 transcripts in DCs incubated with Orn, putrescine (Put), spermidine (Spd), or spermine (Spm; all at 20 μM) or medium alone for 24 hr. Data are normalized and presented as in Figure 1A. p < 0.05 and ∗∗p < 0.01 (unpaired Student’s t test; Orn- or polyamine-treated versus untreated samples). (C) Kinetics of Src phosphorylation in WT DCs incubated with Put, Spd, or Spm at 20 μM for different times. Cell lysates were analyzed by sequential immunoblotting with antibody to phosphorylated Src (pSrc), anti-Src, and β-tubulin. (D) In vivo suppression assay with a minority fraction (5%) of WT or Ido1−/− CD8 DCs with no conditioning (Unt) or conditioned in vitro with 20 μM spermidine in the presence or absence of PP2 or PP3 at 5 μM; analysis of skin reactivity is as in Figure 4C. ∗∗p < 0.01 and ∗∗∗p < 0.001 (paired Student’s t test as in Figure 4C). Data are from one experiment representative of two (A) and three (B–D; means ± SD of triplicates in B and six samples in D). Please see also Figure S4.
Figure 7
Figure 7
MDSCs Confer DCs an IDO1-Dependent, Immunosuppressive Phenotype via Arg1 Metabolites (A) General scheme of transwell experiments. Purified MDSCs, expressing high amounts of Arg1 (data not shown), were pre-incubated for 1 hr with medium alone, nor-NOHA (100 μM), or DMFO (1 mM), prior to incubation with CD8 DCs for 24 hr. (B) Ido1 transcript expression in DCs conditioned as in (A). Data are normalized and presented as in Figure 1A. ∗∗p < 0.01 (unpaired Student’s t test; DCs conditioned with MDSCs alone or pretreated with enzyme inhibitors versus unconditioned DCs). (C) In vivo suppression as in Figure 4C with a minority fraction (5%) of WT or Ido1−/− CD8 DCs preconditioned in vitro in transwells for 24 hr with MDSCs preincubated as in (A); analysis of skin reactivity is as in Figure 4C. ∗∗∗p < 0.001 (paired Student’s t test as in Figure 4C). Data are from one experiment representative of three (B and C; means ± SD of triplicates in B and six samples in C). Please see also Figure S5.

References

    1. Anderson D.P., Whitney D.S., Hanson-Smith V., Woznica A., Campodonico-Burnett W., Volkman B.F., King N., Thornton J.W., Prehoda K.E. Evolution of an ancient protein function involved in organized multicellularity in animals. eLife. 2016;5:e10147. - PMC - PubMed
    1. Banchereau J., Steinman R.M. Dendritic cells and the control of immunity. Nature. 1998;392:245–252. - PubMed
    1. Belladonna M.L., Volpi C., Bianchi R., Vacca C., Orabona C., Pallotta M.T., Boon L., Gizzi S., Fioretti M.C., Grohmann U., Puccetti P. Cutting edge: Autocrine TGF-beta sustains default tolerogenesis by IDO-competent dendritic cells. J. Immunol. 2008;181:5194–5198. - PubMed
    1. Belladonna M.L., Orabona C., Grohmann U., Puccetti P. TGF-beta and kynurenines as the key to infectious tolerance. Trends Mol. Med. 2009;15:41–49. - PubMed
    1. Bessede A., Gargaro M., Pallotta M.T., Matino D., Servillo G., Brunacci C., Bicciato S., Mazza E.M., Macchiarulo A., Vacca C. Aryl hydrocarbon receptor control of a disease tolerance defence pathway. Nature. 2014;511:184–190. - PMC - PubMed

Publication types

MeSH terms