. 2017 Feb 23;168(5):801-816.e13.
doi: 10.1016/j.cell.2017.01.021. Epub 2017 Feb 16.

CpG Island Hypermethylation Mediated by DNMT3A Is a Consequence of AML Progression

Affiliations

CpG Island Hypermethylation Mediated by DNMT3A Is a Consequence of AML Progression

David H Spencer et al. Cell. .

Abstract

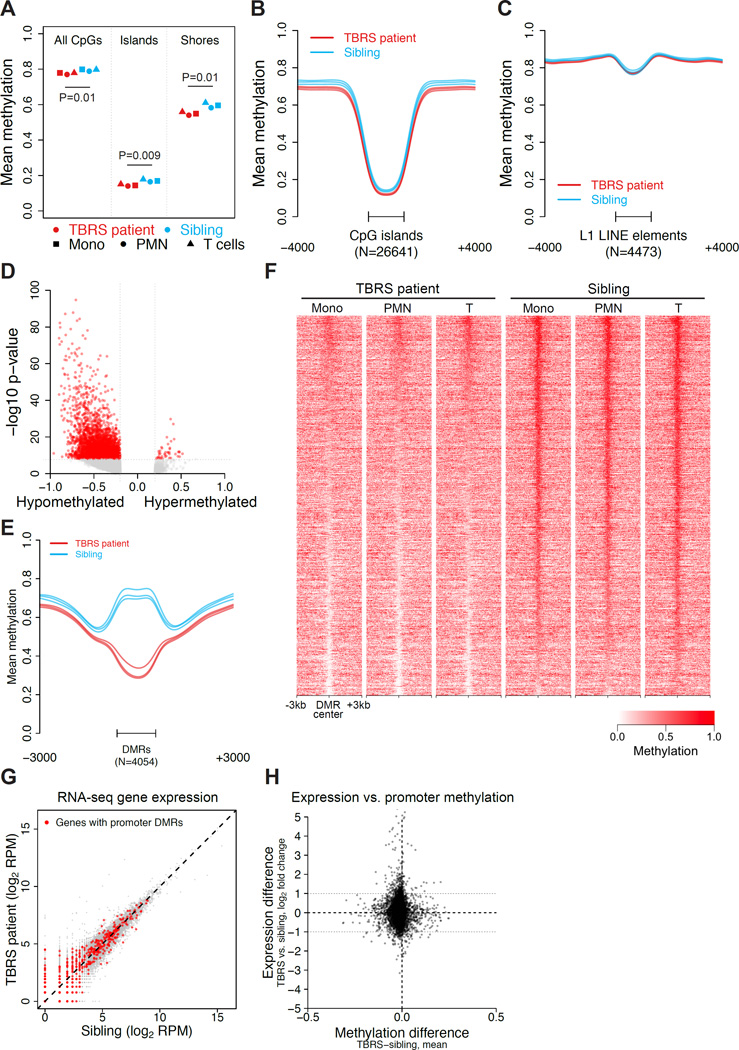
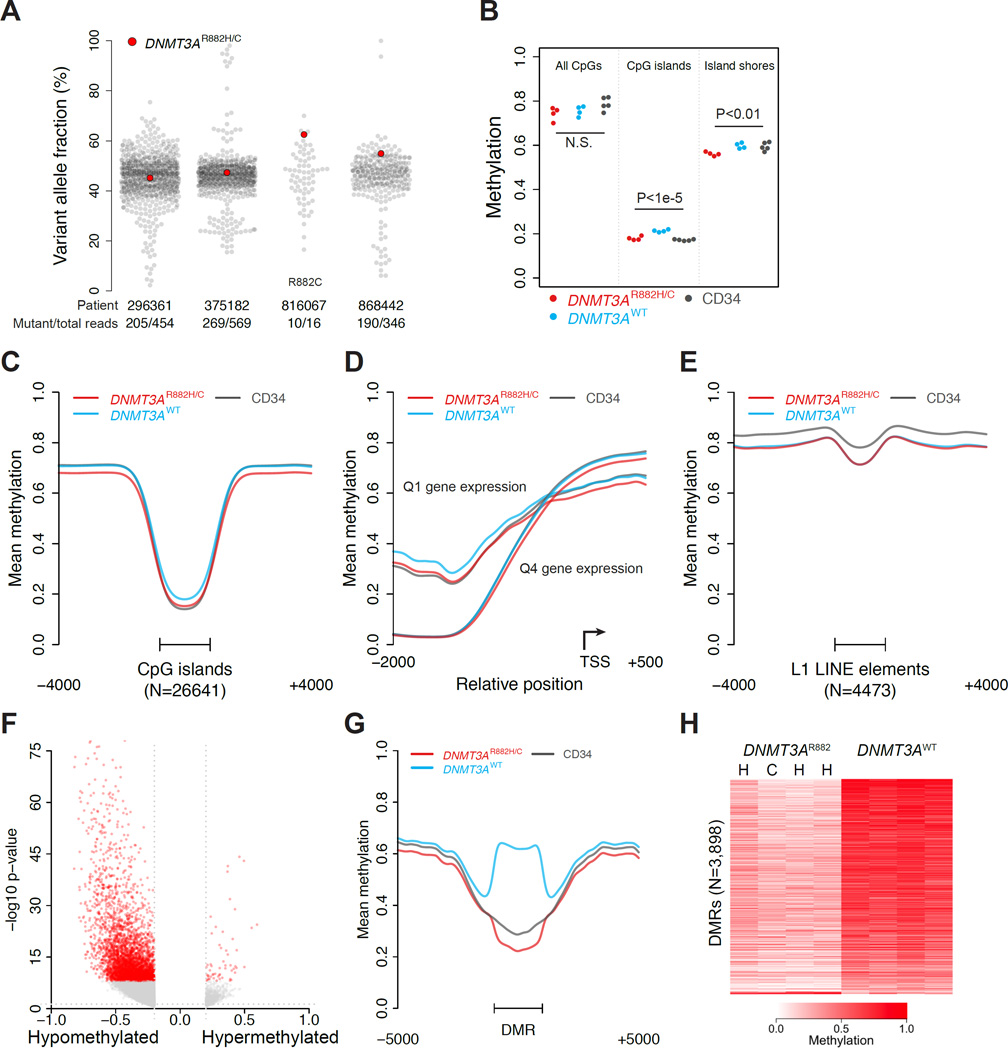
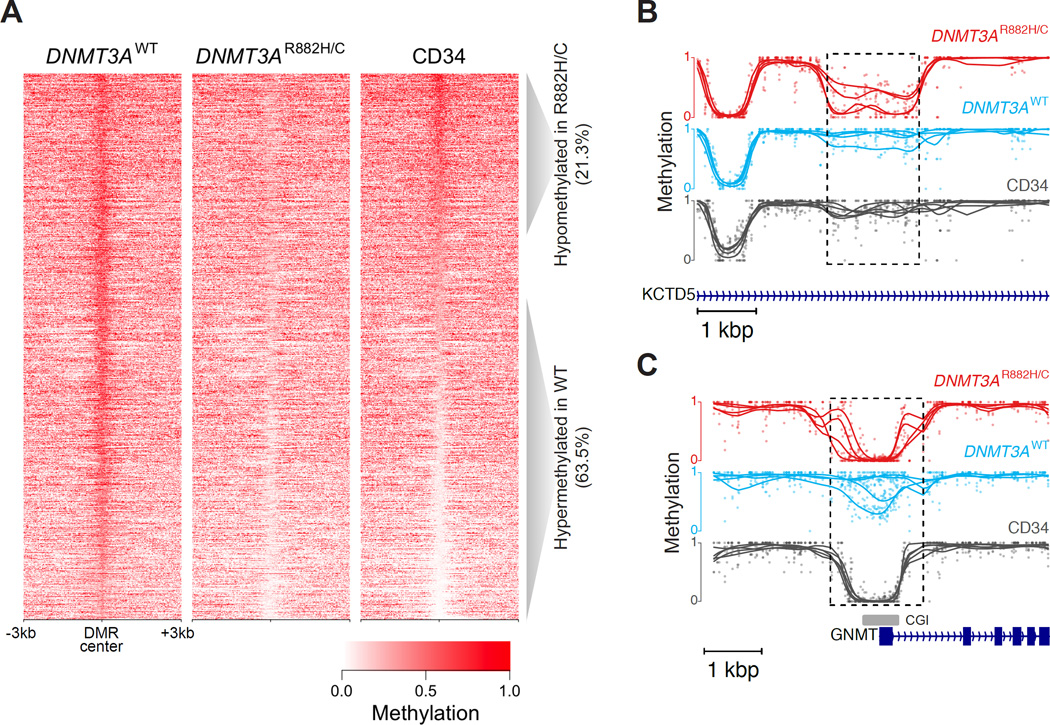
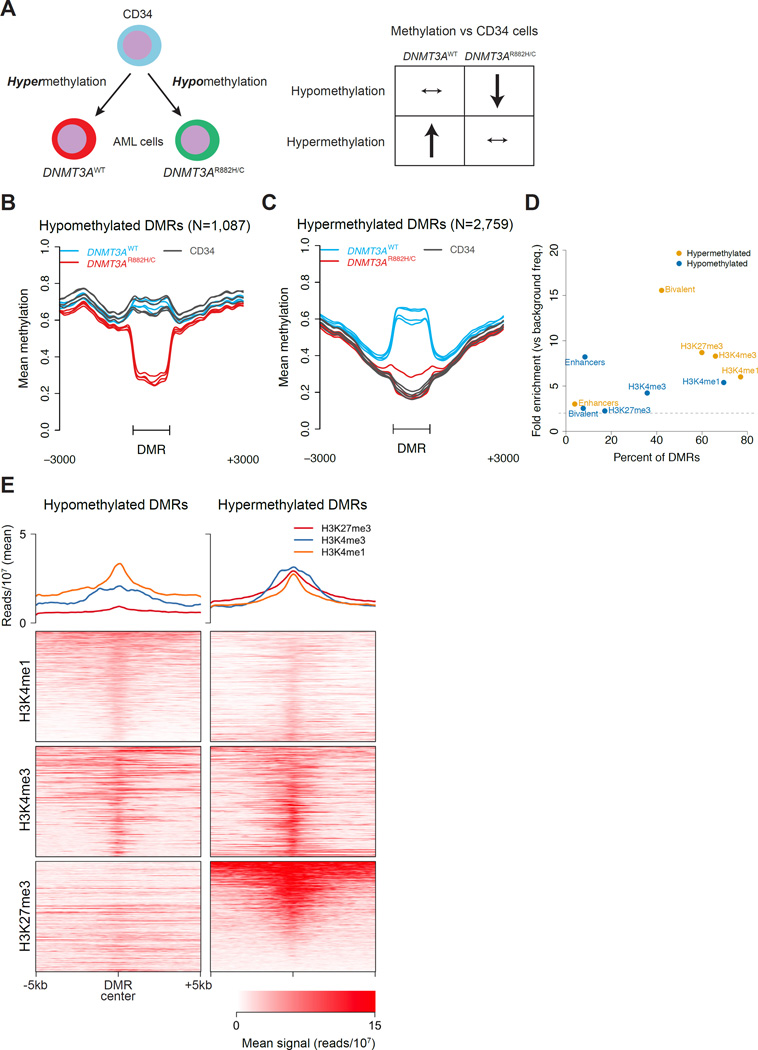
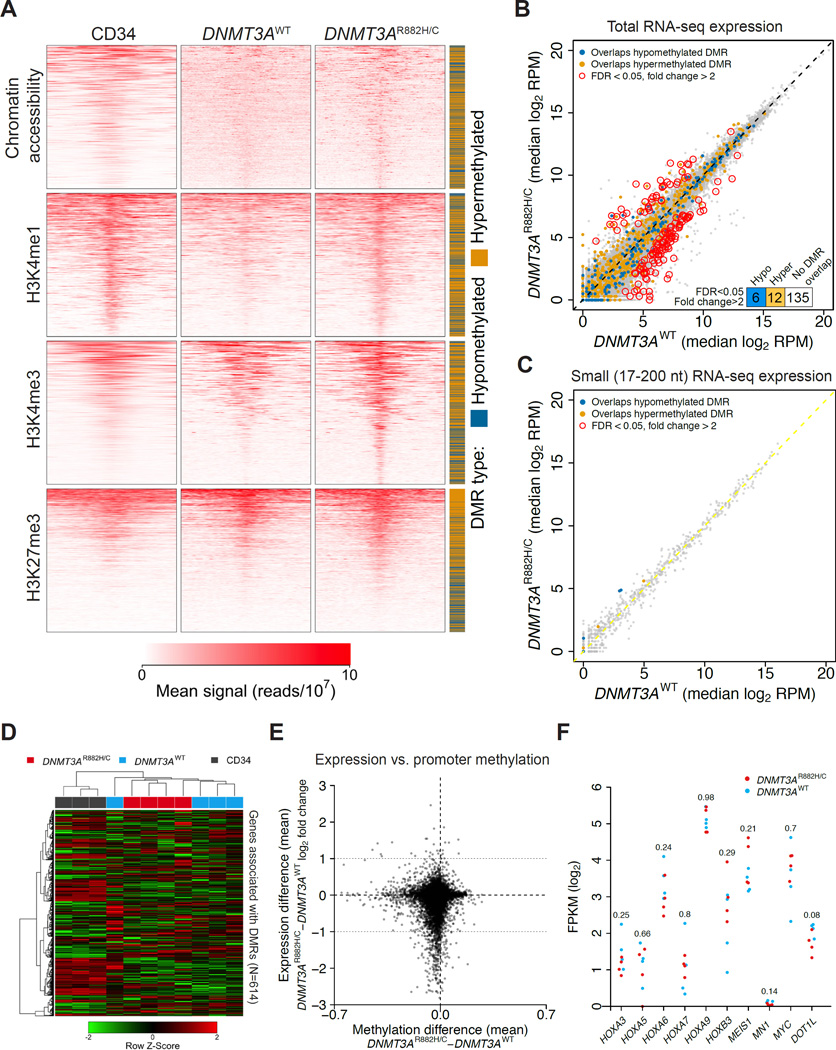
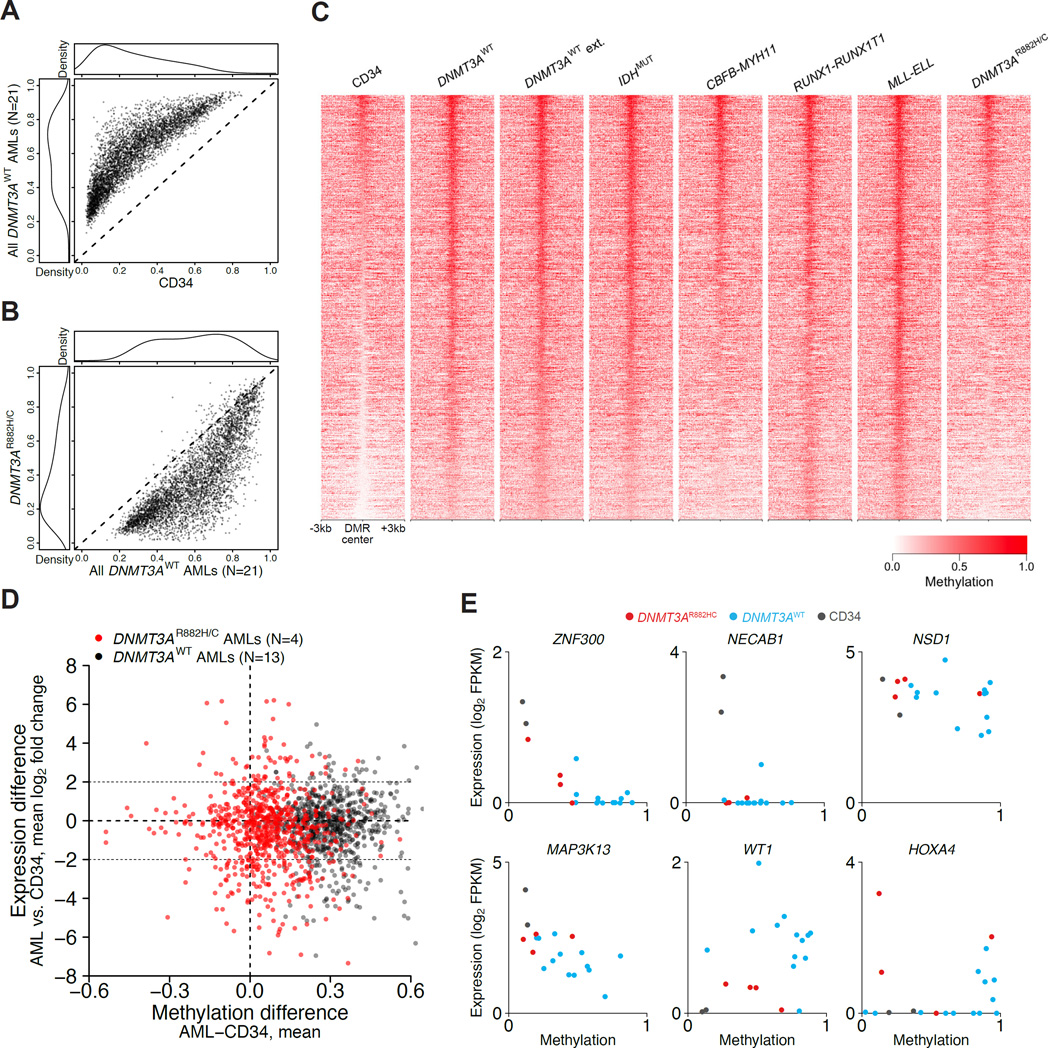
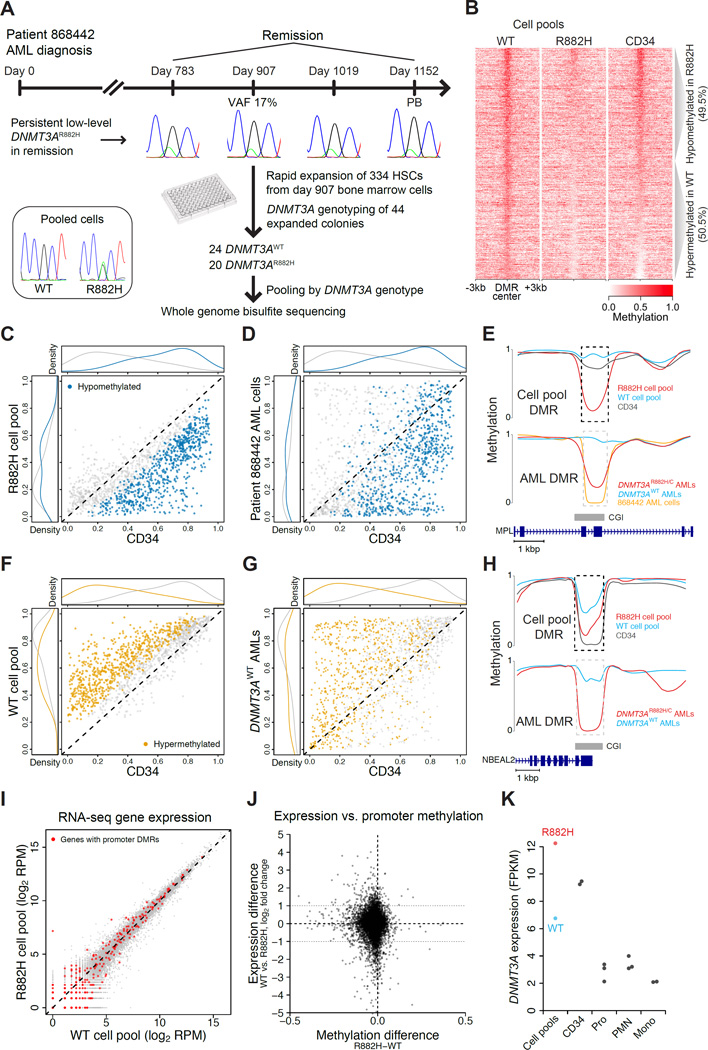
DNMT3A mutations occur in ∼25% of acute myeloid leukemia (AML) patients. The most common mutation, DNMT3AR882H, has dominant negative activity that reduces DNA methylation activity by ∼80% in vitro. To understand the contribution of DNMT3A-dependent methylation to leukemogenesis, we performed whole-genome bisulfite sequencing of primary leukemic and non-leukemic cells in patients with or without DNMT3AR882 mutations. Non-leukemic hematopoietic cells with DNMT3AR882H displayed focal methylation loss, suggesting that hypomethylation antedates AML. Although virtually all AMLs with wild-type DNMT3A displayed CpG island hypermethylation, this change was not associated with gene silencing and was essentially absent in AMLs with DNMT3AR882 mutations. Primary hematopoietic stem cells expanded with cytokines were hypermethylated in a DNMT3A-dependent manner, suggesting that hypermethylation may be a response to, rather than a cause of, cellular proliferation. Our findings suggest that hypomethylation is an initiating phenotype in AMLs with DNMT3AR882, while DNMT3A-dependent CpG island hypermethylation is a consequence of AML progression.

Keywords: AML; CpG island hypermethylation; DNA methylation; DNMT3A; leukemia.


Figures

Figure 1
Figure 1. Focal hypomethylation in the non-leukemic hematopoietic cells of a patient with Tatten-Brown-Rahman Syndrome (TBRS) with a constitutional DNMT3AR882H mutation
A) Mean methylation levels from whole-genome bisulfite sequencing of monocytes (Mono), polymorphonuclear cells (PMN), and CD3+ T cells (T cells) from a patient with Tatten-Brown-Rahman Syndrome and the patient’s sibling. Hypothesis testing was performed via a t-test. B, C) Aggregate (mean) methylation at CpG islands (panel B) and LINE elements (panel C) from all cell types from the TBRS patient and sibling. D) Significance vs. methylation difference for DMRs identified between WGBS data from the TBRS patient and his normal sibling. E) Aggregate methylation for all cell types from 4,045 hypomethylated DMRs identified by comparing samples from the TBRS patient and sibling. F) Locus heatmaps of methylation at DMR loci identified in the monocytes, PMNs, and T cells from the TBRS patient vs. the patient’s sibling. G) Gene expression from RNA-seq of total peripheral blood leukocytes from the TBRS patient and sibling. Genes with hypomethylated promoter DMRs are indicated in red. H) Expression vs. promoter methylation difference for all expressed genes. Each point shows the expression difference for a single gene between the TBRS patient and sibling (log2 fold change) plotted vs. the mean difference in promoter methylation across all cell types from each individual. Also see Figure S1.
Figure 2
Figure 2. Whole-genome bisulfite sequencing of primary AML samples with and without DNMT3AR882H or DNMT3AR882C mutations
A) Variant allele fraction plots of all somatic mutations identified in the four DNMT3AR882H/C AML samples used in this study, with the DNMT3AR882H/C allele shown in red. B) Mean methylation values across all CpGs, and of CpGs in annotated CpG islands and island shores. Hypothesis testing was performed via a t-test. C–E) Aggregate (mean) methylation of AML and CD34 samples at CpGs in CpG islands (+/− 4 kbp), promoters of genes in the top and bottom expression quartiles, and L1 line elements with ≥50 CpGs. F) Significance vs. methylation difference for differentially methylated regions (DMRs) between DNMT3AR882H/C and DNMT3AWT AML samples (N=4, each). G) Aggregate (mean) methylation of CpGs across 3,898 DMRs from DNMT3AR882H/C AMLs (N=4), DNMT3AWT AMLs (N=4), and CD34 cells (N=5). H) Heatmap showing the methylation values of 3,898 DMRs in each DNMT3AR882H/C and DNMT3AWT AML sample (H=DNMT3AR882H, C=DNMT3AR882C). Also see Figure S2.
Figure 3
Figure 3. DNMT3AR882H/C AMLs display both methylation loss and reduced hypermethylation relative to normal CD34 cells and DNMT3AWT AMLs
A) Locus heatmaps of mean CpG methylation across 6 kbp windows centered on DMR loci defined by comparing DNMT3AWT AMLs (N=4) vs. DNMT3AR882H/C AMLs (N=4). The methylation values for the same DMRs in normal donor-derived CD34 cells were plotted “passively” (N=5). B, C) Examples of DNMT3A-dependent loci with high methylation vs. low methylation in CD34 cells (B and C, respectively). Also see Figure S3.
Figure 4
Figure 4. Regions with DNMT3A-dependent hypomethylation and hypermethylation in AML cells occupy distinct genomic and epigenomic niches
A) Schematic showing possible origins of hypomethylated loci in DNMT3AR882H/C vs. DNMT3AWT AMLs, and the classification scheme used to call DMRs as hypomethylated and hypermethylated (see also Experimental Procedures). B, C) Aggregate (mean) methylation at 1,087 hypomethylated DMRs (with respect to CD34 cells, panel B), and 2,759 hypermethylated DMRs (with respect to CD34 cells, panel C) from each of the DNMT3AR882H/C and DNMT3AWT AML samples (N=4, each), along with normal CD34 cells (N=5), which were plotted passively for the same loci. In both panels, DMRs have been scaled to a uniform length, and are shown with the adjacent 3 kbp of flanking sequence. D) Association of hypomethylated and hypermethylated DMRs with conserved epigenomic features identified in a subset of the primary AML samples and in normal CD34 cells. E) Signal intensities (top panels) and locus heatmaps (bottom panels) of mean histone methylation ChIP-seq signals for DNMT3AWT and DNMT3AR882H/C AML samples and normal CD34 cells (N=3, each) at hypomethylated DMRs (N=574, left panel), and hypermethylated DMRs (N=2,139, right panel). Rows represent individual DMRs, and show normalized signals in a 10 kbp window centered on the DMR. Also see Figure S4.
Figure 5
Figure 5. DNMT3AR882H/C-associated hypomethylation is associated with minimal changes in epigenomic states and transcriptional activity
A) Mean signal intensities of chromatin accessibility (ATAC-seq) and histone methylation at DMRs defined by the comparison of DNMT3AR882H/C AMLs vs. DNMT3AWT AMLs (N=3 each). B) Comparison plot of gene expression values in DNMT3AR882H/C AMLs (Y axis) vs. DNMT3AWT AMLs (X axis) (N=4, each) from total RNA-seq. C) Comparison plot of median expression values from small RNA-seq data (17–200 nt). D) Heatmap of normalized (Z-score) expression values for 595 expressed genes with promoter-associated DMRs defined by the comparison of DNMT3AR882H/C vs. DNMT3AWT AMLs (N=4 each). E) Expression vs. methylation difference plots for all expressed genes between DNMT3AR882H/C and DNMT3AWT AMLs. F) Expression of specific genes previously reported to be dependent on functional DNMT3A in AML patients or mouse models (Guryanova et al., 2016; Jeong et al., 2013; Rau et al., 2016; Yan et al., 2011), using data obtained in this study. P-values for each comparison (via t-test) are indicated above the columns. Also see Figure S5.
Figure 6
Figure 6. CpG island hypermethylation is attenuated in AMLs with DNMT3AR882H/C mutations
A) Mean methylation values in hypermethylated DMRs (N=4,912) defined by comparing DNMT3AWT AMLs (N=21) and CD34 cells (N=5). B) Mean methylation values in DNMT3AR882H/C AMLs compared to DNMT3AWT AMLs (N=21) at the same hypermethylated DMRs. C) Locus heatmap showing the mean methylation values across 6 kbp windows centered on the hypermethylated DMRs defined above, using values from CD34 cells and various AML sample sets with and without DNMT3AR882H/C mutations. ‘DNMT3AWT ext.’ refers to addition AML samples that had no detected mutations in DNMT3A or other genes associated with methylation phenotypes (IDH1/2, or TET2). All other AML categories shown were also wild-type for DNMT3A, and included cases with canonical IDH1 or IDH2 mutations (IDHMUT), or canonical fusions involving CBFB-MYH11, RUNX1-RUNX1T1, or MLL-ELL. Methylation values for these DMRs are plotted passively for the DNMT3AR882H/C AMLs. D) Expression vs. promoter methylation difference plots between DNMT3AWT (black points) and DNMT3AR882H/C AMLs (red points) compared to CD34 cells. E) Expression and DMR methylation values for six genes with hypermethylated promoter CpG islands, including samples from normal CD34 cells (N=2), DNMT3AWT AMLs (N=13), and DNMT3AR882H/C AMLs (N=4), which show variable patterns of expression and promoter methylation. Also see Figure S6.
Figure 7
Figure 7. DNMT3A-dependent CpG island hypermethylation can occur during rapid proliferation in non-leukemic hematopoietic cells
A) Schema for purification and expansion of DNMT3AR882H vs. DNMT3AWT bone marrow cells from a remission bone marrow sample from AML patient 868442. B) Locus heatmaps of methylation values at 1,407 hypomethylated DMRs identified between the DNMT3AR882H and DNMT3AWT remission cell pools, and plotted passively for the same regions for normal CD34 cells (N=5). C, D) Hypomethylated DMRs (N=710) in the DNMT3AR882H remission cells, shown in comparison to methylation values in CD34 cells (panel C), and in primary AML cells from the same patient (868442), vs. CD34 cells (panel D). E) Example locus that is hypomethylated in the remission DNMT3AR882H cell pool, and maintained in the AML cells from the same patient. F, G) Hypermethylated DMRs that gained methylation in the DNMT3AWT remission cell pool vs. CD34 cells (panel F), and which are also hypermethylated in other AML samples with wild-type DNMT3A (panel G). H) Example locus that is hypermethylated in the DNMT3AWT remission cell pool and also in DNMT3AWT AML samples. I) Gene expression measured by RNA-seq from the DNMT3AWT and DNMT3AR882H cell pools, showing minimal expression differences in genes with promoter DMRs. J) Expression vs. promoter methylation difference plot between DNMT3AR882H and DNMT3AWT remission cell pools. K) Expression of DNMT3A in the remission cell pools compared to normal CD34 cells, promyelocytes (Pro), polymorphonuclear cells (PMN), and monocytes (Mono).

Similar articles

Cited by

References

    1. Baylin SB, Höppener JW, de Bustros A, Steenbergh PH, Lips CJ, Nelkin BD. DNA methylation patterns of the calcitonin gene in human lung cancers and lymphomas. Cancer Research. 1986;46:2917–2922. - PubMed
    1. Baylin S, Bestor TH. Altered methylation patterns in cancer cell genomes: cause or consequence? Cancer Cell. 2002;1:299–305. - PubMed
    1. Bernstein BE, Stamatoyannopoulos JA, Costello JF, Ren B, Milosavljevic A, Meissner A, Kellis M, Marra MA, Beaudet AL, Ecker JR, et al. The NIH Roadmap Epigenomics Mapping Consortium. Nature Biotechnology. 2010;28:1045–1048. - PMC - PubMed
    1. Buenrostro JD, Giresi PG, Zaba LC, Chang HY, Greenleaf WJ. Transposition of native chromatin for fast and sensitive epigenomic profiling of open chromatin, DNA-binding proteins and nucleosome position. Nature Methods. 2013;10:1213–1218. - PMC - PubMed
    1. Cancer Genome Atlas Research Network. Genomic and epigenomic landscapes of adult de novo acute myeloid leukemia. N Engl J Med. 2013;368:2059–2074. - PMC - PubMed

Substances

LinkOut - more resources