Comment
. 2017 Feb 23;168(5):817-829.e15.
doi: 10.1016/j.cell.2017.01.020. Epub 2017 Feb 16.

KRAS Allelic Imbalance Enhances Fitness and Modulates MAP Kinase Dependence in Cancer

Affiliations
Comment

KRAS Allelic Imbalance Enhances Fitness and Modulates MAP Kinase Dependence in Cancer

Michael R Burgess et al. Cell. .

Abstract

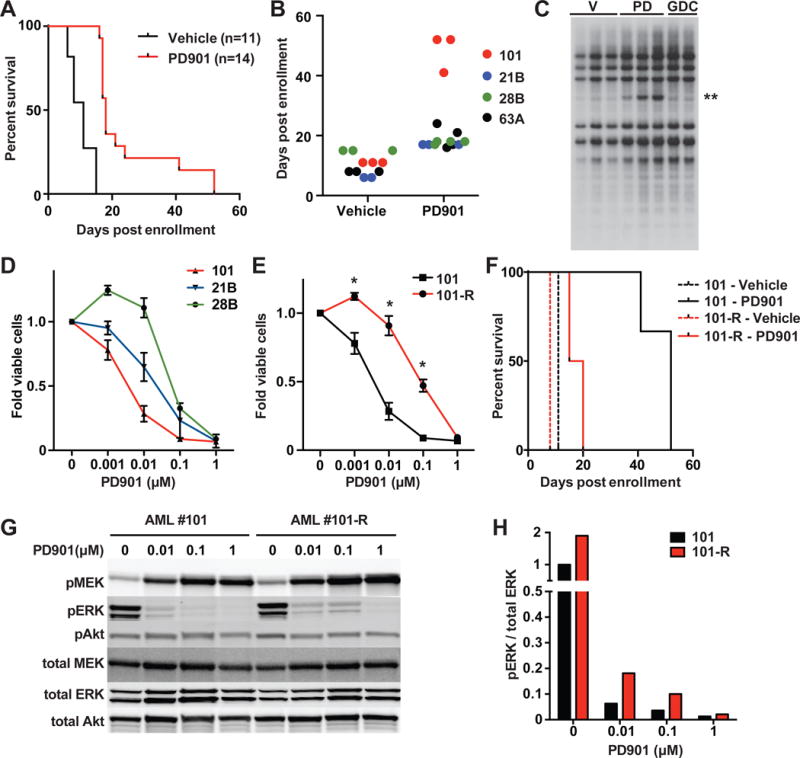
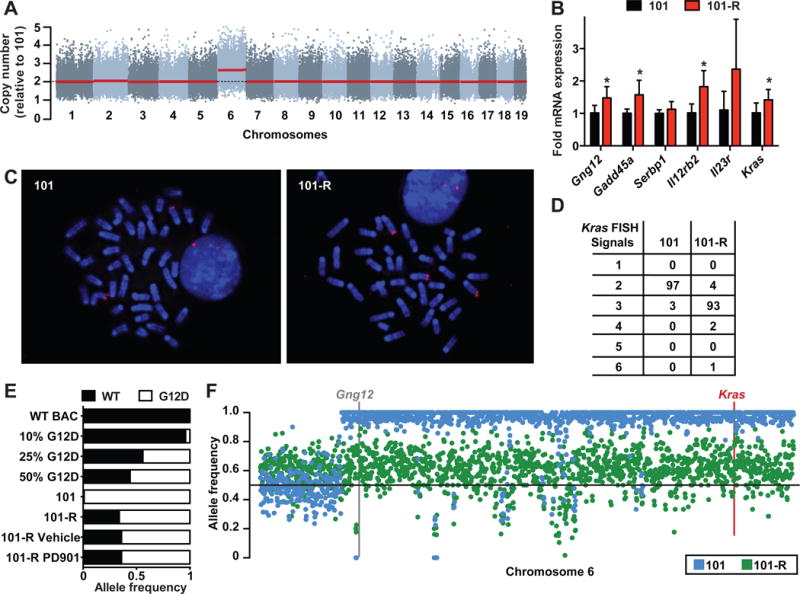
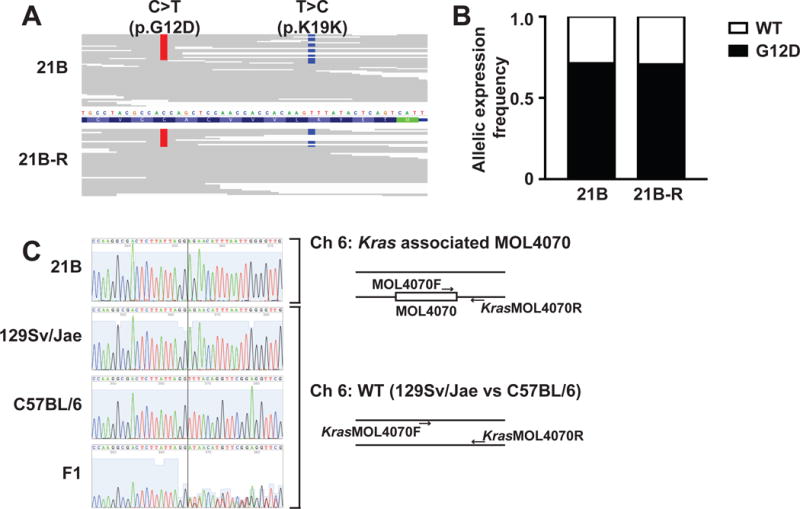
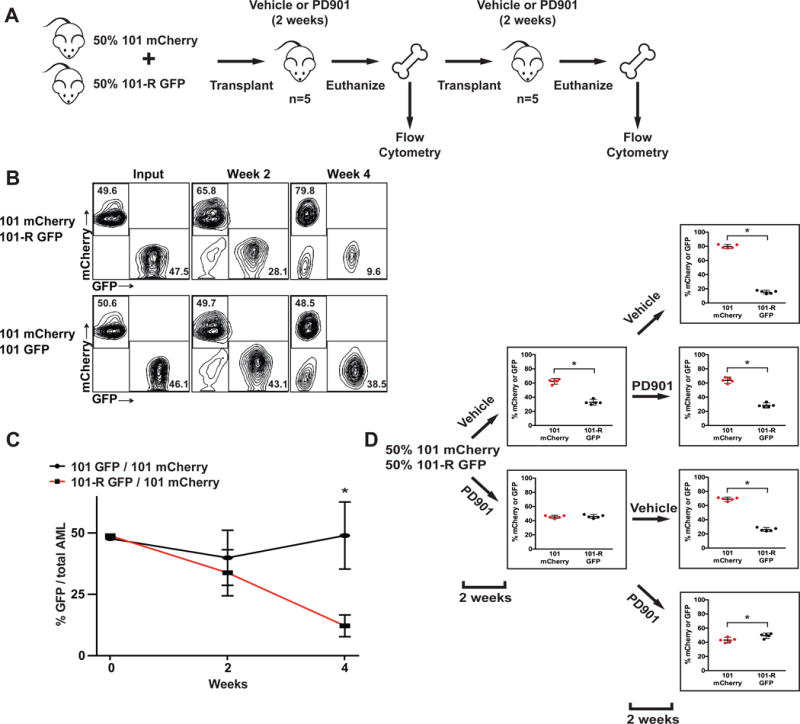
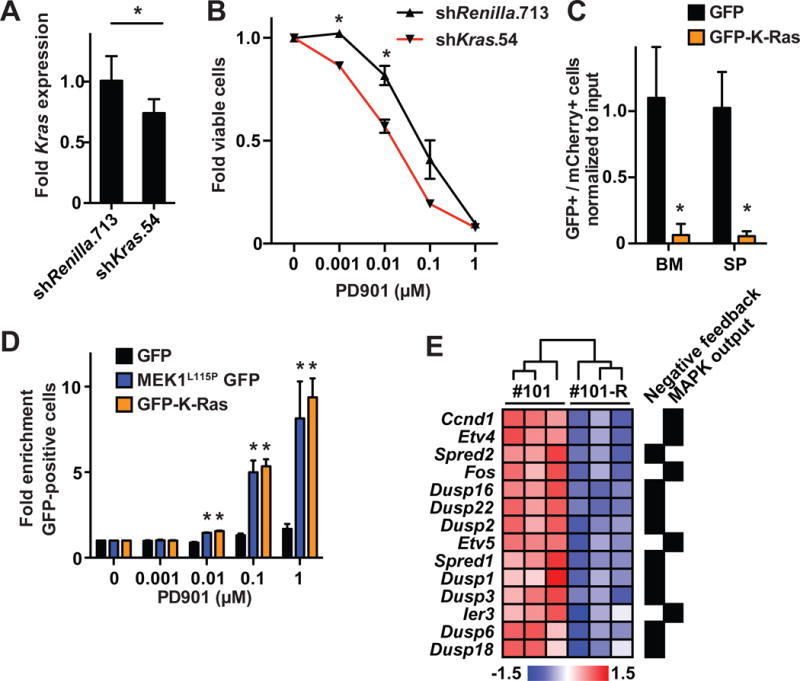
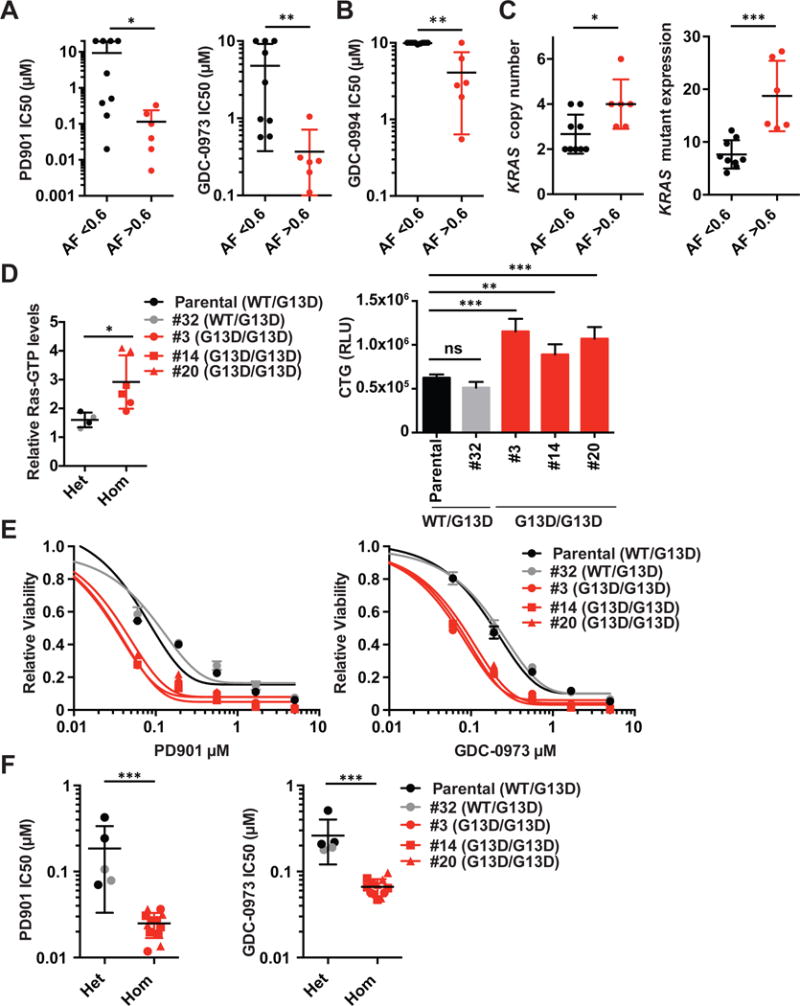
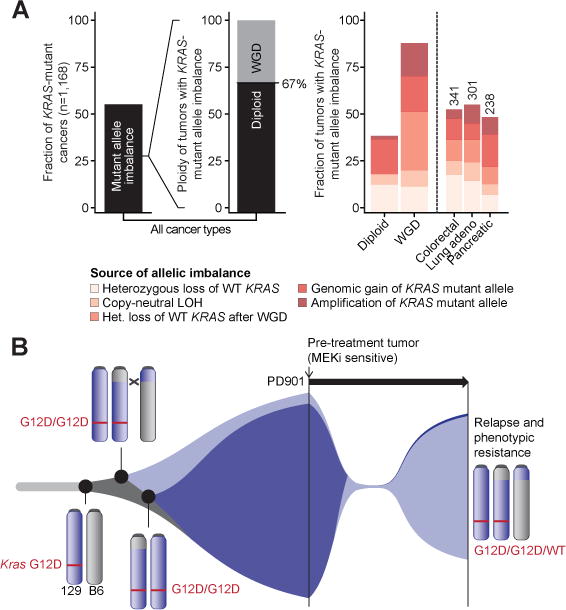
Investigating therapeutic "outliers" that show exceptional responses to anti-cancer treatment can uncover biomarkers of drug sensitivity. We performed preclinical trials investigating primary murine acute myeloid leukemias (AMLs) generated by retroviral insertional mutagenesis in KrasG12D "knockin" mice with the MEK inhibitor PD0325901 (PD901). One outlier AML responded and exhibited intrinsic drug resistance at relapse. Loss of wild-type (WT) Kras enhanced the fitness of the dominant clone and rendered it sensitive to MEK inhibition. Similarly, human colorectal cancer cell lines with increased KRAS mutant allele frequency were more sensitive to MAP kinase inhibition, and CRISPR-Cas9-mediated replacement of WT KRAS with a mutant allele sensitized heterozygous mutant HCT116 cells to treatment. In a prospectively characterized cohort of patients with advanced cancer, 642 of 1,168 (55%) with KRAS mutations exhibited allelic imbalance. These studies demonstrate that serial genetic changes at the Kras/KRAS locus are frequent in cancer and modulate competitive fitness and MEK dependency.

Keywords: AML; KRAS; MEK inhibition; allelic imbalance; colorectal cancer; drug resistance.


Figures

Figure 1
Figure 1. Response of KrasG12D AMLs to PD901 extends survival and identification of AML 101 as an exceptional responder
(A) Kaplan-Meier analysis demonstrates longer survival of recipients transplanted with KrasG12D AMLs assigned to receive PD901 (p<0.0001 by log-rank test). (B) Survival analysis of individual recipient mice identifies AML 101 as a therapeutic outlier. (C) Leukemia DNA isolated at death from independent recipient mice transplanted with AML 101 that were treated with either control vehicle (V, n=3), PD901 (PD, n=3), or GDC-0941 (GDC, n=2) was digested with HindIII and probed for MOL4070LTR integrations. A restriction fragment that is highly enriched in PD901-treated mice is indicated with two asterisks. (D) Normalized viable cell counts of KrasG12D AMLs grown in liquid cultures containing increasing doses of PD901 (n≥3 mice per leukemia). (E) Normalized viable cell count of AMLs 101 and 101-R in liquid cultures containing a range of PD901 concentrations (n≥5 independent recipient mice per leukemia). Asterisks indicate significantly greater survival of AML 101-R at 0.1, 0.01, and 0.001 μM of PD901 (p<0.05 by unpaired Student’s t-test). (F) Survival of mice transplanted with AML 101 (black) treated with control vehicle (n=3, broken line) or PD901 (n=3, solid line). AML 101-R (red) was isolated from PD901-treated mice at relapse, retransplanted, and retreated with vehicle (n=3, broken line) or PD901 (n=4, solid line). The sensitivity of AML 101-R to PD901 is significantly reduced relative to AML 101 (p=0.019 by log-rank test). (G) AMLs 101 and 101-R were cultured in saturating amounts of growth factors and 0 – 1.0 μM PD901 for 24 hours, lysed, and analyzed by Western blot to measure total and phosphorylated (p) MEK, ERK, and Akt levels. (H) Quantification of phosphorylated ERK relative to total ERK levels from the Western blot data shown in panel G. See also Figure S1; Table S1 and S2.
Figure 2
Figure 2. Trisomy 6 with KrasG12D duplication in AML 101-R
(A) Copy number analysis inferred from WES data of AMLs 101 and 101-R identifies chromosome 6 gain in AML 101-R. Copy number in AML 101-R is shown relative to AML 101 for murine chromosomes 1–19 from left to right. Red line reflects the inferred segmental copy number for each chromosome. (B) RT-PCR analysis showing increased expression of chromosome 6 transcripts in AML 101-R (red, n=6) normalized to AML 101 (black, n=5) (asterisks indicate p-value<0.05 by unpaired Student’s t-test). (C) FISH analysis of AML 101 and 101-R with a probe that includes the Kras locus labels two chromosome 6 homologs in AML 101 (left panel) and three in AML 101-R (right panel). (D) The distribution of Kras FISH signals in AML 101 and 101-R interphase nuclei (n=100 of each). (E) Kras exon 2 was PCR amplified from genomic DNA, cloned into a shuttling vector, and individual transformants were sequenced. Control PCR is shown for calibration. Of 83 independent Kras sequences obtained from AML 101, 82 contained the oncogenic G12D substitution. By contrast, 57 of 87 individual amplicons sequenced from AML 101-R contained the G12D mutation. This allele frequency was stable in AML 101-R cells collected from recipient mice after treatment with PD901 or vehicle (n=16/25 in both). (F) SNP allele frequency analysis of 129Sv/Jae across the length of murine chromosome 6 in AML 101 (blue) and 101-R (green). The locations of Gng12 and Kras are shown with the centromere on the left. Note the breakpoint in AML 101 at the site of the UPD event. See also Figure S2; Tables S1 and S2.
Figure 3
Figure 3. MOL4070 integration promotes expression of KrasG12D in AML 21B
(A) Aligned Kras sequencing reads from WES data of AML 21B (top) and 21B-R (bottom). The allele calls for the C>T mutation coding for KrasG12D are shown in red, and those for a T>C SNP (K19K) thats differ between the 129Sv/Jae and C57BL/6 strains are shown in blue. (B) Allelic expression frequencies of WT and KrasG12D in AML 21B and 21B-R. Kras exon 2 was PCR amplified from cDNA generated from amplifying, cloning, and sequencing individual cDNA molecules (n=96 per leukemia) made from total bone marrow RNA, cloned into a shuttling vector, and individual transformants were sequenced. (C) On the left, sequence of PCR products generated from flanking regions of MOL4070LTR integration upstream of the Kras locus in AML 21B and the corresponding genomic regions in WT 129Sv/Jae, C57BL/6, and F1 mice. A vertical line identifies an indel that differs between the murine 129Sv/Jae and C57BL/6 strains. The MOL4070LTR integration occurred on the 129Sv/Jae chromosome 6 homolog, which harbors the KrasG12D allele. The PCR strategy for sequencing the SNP proximal to the MOL4070LTR integration is summarized on the right. See also Table S1 and S2.
Figure 4
Figure 4. AML 101 out-competes AML 101-R in vivo, and PD901 treatment abrogates this growth advantage
(A) Overview of competitive fitness experiments. (B) AML 101 and 101-R cells infected with a lentiviral construct expressing GFP were mixed at a 1:1 ratio with AML 101 competitor cells labeled with mCherry and transplanted into recipient mice (n=4). These mice were euthanized after two weeks and bone marrow was transferred into secondary recipients. Flow cytometric analysis reveals outgrowth of mCherry-labeled AML 101 cells over time (top panel). By contrast, co-transplanting mCherry and GFP-labeled AML 101 cells results in stable chimerism (bottom panel). (C) Combined data from all recipients of AML 101-R/GFP cells mixed with AML 101/mCherry competitors (asterisks indicate a p-value<0.001 by unpaired Student’s t-test at the four-week time point). (D) AMLs 101 and 101-R were labeled with mCherry and GFP reporters, respectively, co-injected into recipients (n=5 recipients per group), and passaged into secondary mice as above in panels A and B. Recipients were assigned to receive either control vehicle or PD901 for the first two weeks, then either continued on the same treatment or “crossed over” as described in the text. The percentages of mCherry and GFP-positive cells in the bone marrow were determined by flow cytometry (asterisks indicate a p-value<0.02 by unpaired Student’s t-test). See also Figure S3; Table S3.
Figure 5
Figure 5. Modulating Kras expression alters PD901 sensitivity in AML 101 and reduces fitness
(A) RT-PCR showing Kras expression in AML 101-R cells infected with vectors encoding shKras.54 (n=3) or control Renilla luciferase (n=4; asterisks indicate a p-value<0.05 by unpaired Student’s t-test). (B) Reduced Kras expression in AML 101-R cells infected with the shKras.54 vector enhances sensitivity to PD901 relative to control cells infected with a shRenilla.713 vector (n=5 independent mice per construct; asterisks indicate a p-value<0.05 by unpaired Student’s t-test). (C) AML 101 cells expressing mCherry were mixed with cells expressing either GFP-K-Ras or GFP and transplanted into recipient mice (n=4 mice per condition). Exogenous GFP-K-Ras expression causes depletion of AML 101 cells in the bone marrow (BM) and spleens (SP) of recipient mice after 10 days (asterisks indicate a p-value<0.001 by unpaired Student’s t-test). (D) AML 101 cells expressing GFP only, MEK1L115P-GFP, or GFP-K-Ras were grown in increasing concentrations of PD901 and the percentage of GFP-positive cells was measured by flow cytometry. AML 101 cells expressing MEK1L115P or WT K-Ras are significantly enriched in the presence of 0.01–1.0 μM PD901 (asterisks indicate a p-value<0.05 by unpaired Student’s t-test compared to control GFP-labeled leukemia cells). (E) Directed bioinformatic analysis demonstrates increased expression of genes associated with increased MAPK pathway output and negative feedback in AML 101 versus 101-R (n=3 mice per AML).
Figure 6
Figure 6. KRAS allelic configuration modulates sensitivity to MAP kinase inhibition in CRC cell lines
(A and B) Comparison of IC50 values to MEK inhibitors PD901 (panel A, left), GDC-0973 (cobimetinib; panel A, right), and ERK inhibitor GDC-0994 (panel B) between CRC cell lines with <0.6 vs >0.6 KRAS mutant allele frequency in 72 hour cell viability assays. Each dot represents a single cell line and depicts the mean of at least three biological replicates. Mean +/− standard deviation (SD) of cell lines belonging to each group is plotted. Asterisks denote a statistically significant difference by Mann-Whitney test (*p<0.05, **p<0.01). (C) Comparison of KRAS copy number (left) and KRAS mutant mRNA levels (right) between CRC cell lines with <0.6 vs >0.6 KRAS mutant allele frequency. Mean +/− standard deviation (SD) of cell lines belonging to each group is plotted. Asterisks denote a statistically significant difference by Mann-Whitney test (*p<0.05, ***p<0.001). (D) Ras-GTP levels (left) and proliferation (right) of parental and CRISPR-modified HCT116 cells in 0.5% FBS. Asterisks denote a statistically significant difference by Mann-Whitney test (*p<0.05, **p<0.01, ***p<0.001). (E) Viability of KRASG13D/G13D and KRASG13D/WT HCT116 cells that were exposed to PD901 (left) or GDC-0973 (cobimetinib)(right) for 72 hours. The graphs are representative of data from n=4 independent experiments. (F) IC50 values of isogenic KRASG13D/G13D (Hom) and KRASG13D/WT (Het) HCT116 cells that were exposed to PD901 (left) or GDC-0973 (cobimetinib)(right) for 72 hours (n=4 independent experiments). Asterisks denote a statistically significant difference by Mann–Whitney test (***p<0.001). See also Figures S4–6; Table S4.
Figure 7
Figure 7. Allelic imbalance in human cancers with KRAS mutations
(A) Left: allelic imbalance in 55% of 1,168 primary KRAS-mutant tumors across 30 cancer types. Of these, 67% are diploid with the remainder exhibiting whole-genome duplication (WGD). Right: the genetic mechanisms underlying KRAS allelic imbalance are compared based on tumor ploidy (diploid vs. WGD) and histology (colorectal vs. lung adenocarcinoma vs. pancreatic). (B) Clonal evolution of AML 101 showing KrasG12D duplication in AMLs 101 and 101-R, with subsequent loss of the chromosome 6 homolog harboring the WT Kras allele in AML 101. AML 101-R may be an evolutionary precursor to the drug sensitive clone or may have evolved independently from a common founder. Treatment with PD901 induces remission by inhibiting AML 101, and selects for the outgrowth of AML 101-R. See also Figure S7.

Comment in

Comment on

References

    1. Al-Ahmadie H, Iyer G, Hohl M, Asthana S, Inagaki A, Schultz N, Hanrahan AJ, Scott SN, Brannon AR, McDermott GC, et al. Synthetic lethality in ATM-deficient RAD50-mutant tumors underlies outlier response to cancer therapy. Cancer Discov. 2014;4:1014–1021. - PMC - PubMed
    1. Bengtsson H, Simpson K, Bullard J. Tech rep D.o Statistics. University of California; Berkeley: 2008. aroma.affymetrix: A generic framework in R for analyzing small to very large Affymetrix data sets in bounded memory.
    1. Bremner R, Balmain A. Genetic changes in skin tumor progression: correlation between presence of a mutant ras gene and loss of heterozygosity on mouse chromosome 7. Cell. 1990;61:407–417. - PubMed
    1. Brown AP, Carlson TC, Loi CM, Graziano MJ. Pharmacodynamic and toxicokinetic evaluation of the novel MEK inhibitor, PD0325901, in the rat following oral and intravenous administration. Cancer Chemother Pharmacol. 2007;59:671–679. - PubMed
    1. Burgess MR, Hwang E, Firestone AJ, Huang T, Xu J, Zuber J, Bohin N, Wen T, Kogan SC, Haigis KM, et al. Preclinical efficacy of MEK inhibition in Nras-mutant AML. Blood. 2014;124:3947–3955. - PMC - PubMed

MeSH terms