. 2017 Feb 23;168(5):856-866.e12.
doi: 10.1016/j.cell.2017.01.023. Epub 2017 Feb 16.

HSP90 Shapes the Consequences of Human Genetic Variation

Affiliations

HSP90 Shapes the Consequences of Human Genetic Variation

Georgios I Karras et al. Cell. .

Abstract

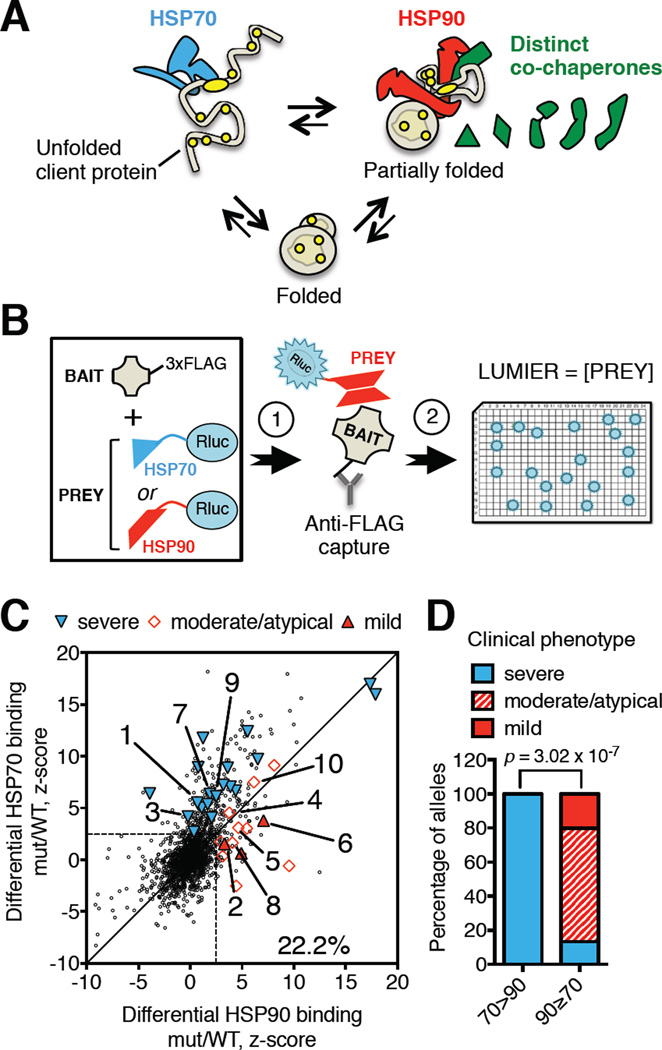
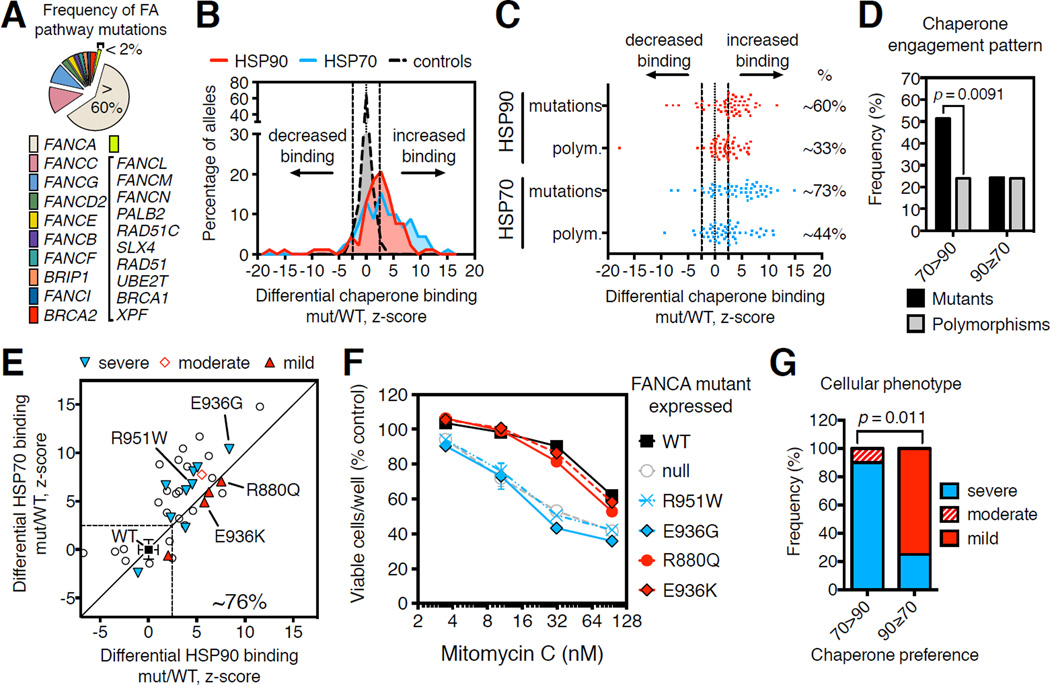
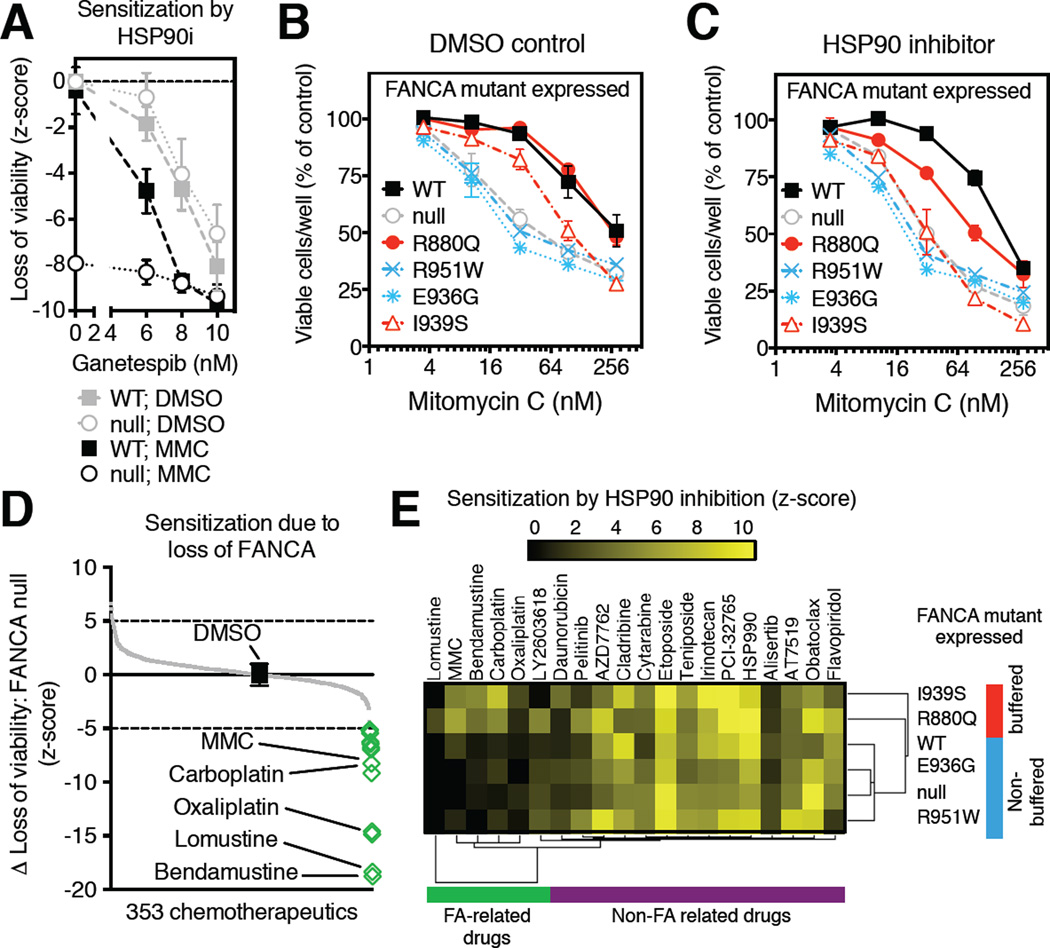
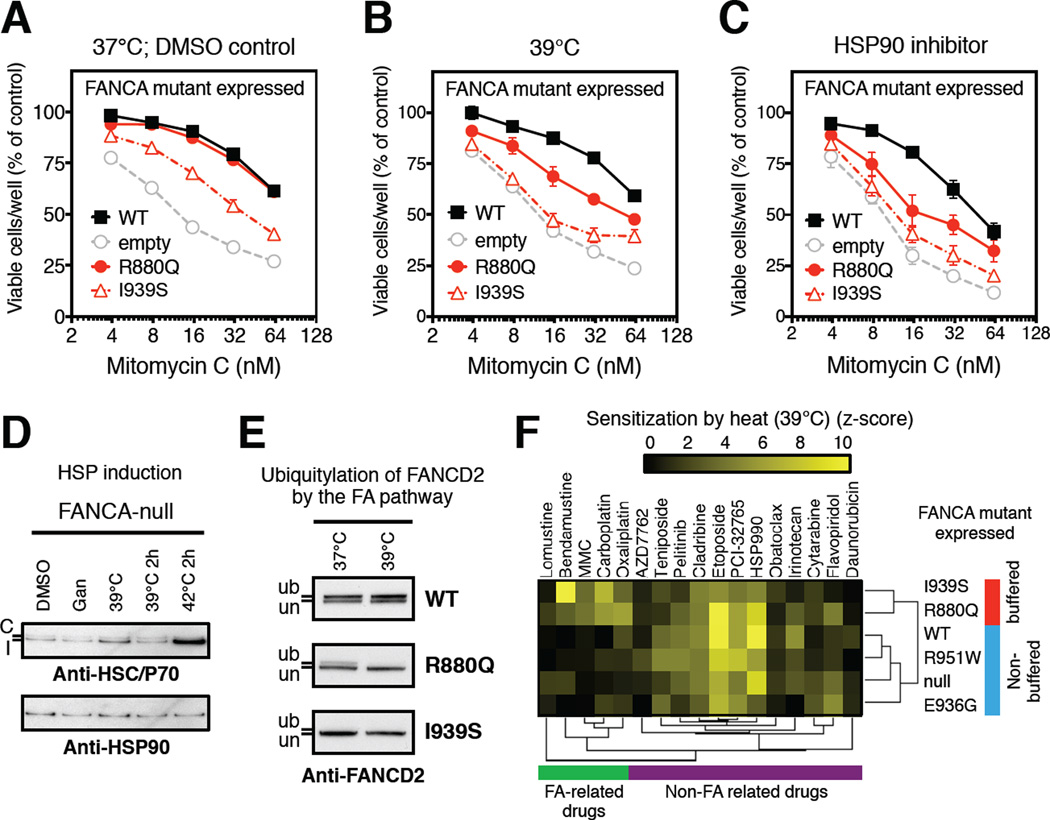
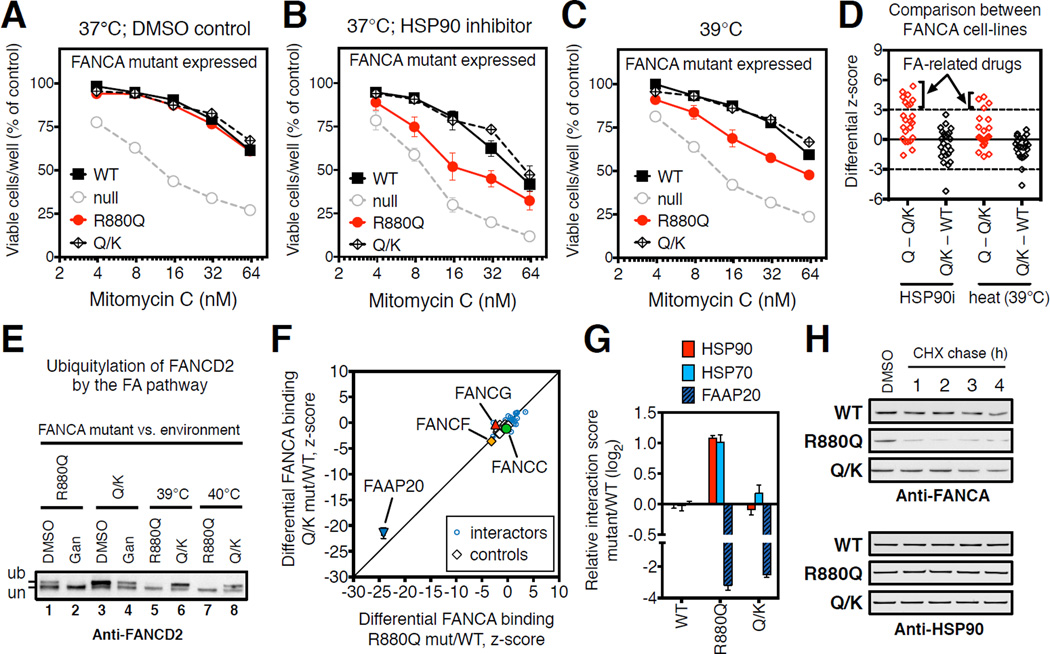
HSP90 acts as a protein-folding buffer that shapes the manifestations of genetic variation in model organisms. Whether HSP90 influences the consequences of mutations in humans, potentially modifying the clinical course of genetic diseases, remains unknown. By mining data for >1,500 disease-causing mutants, we found a strong correlation between reduced phenotypic severity and a dominant (HSP90 ≥ HSP70) increase in mutant engagement by HSP90. Examining the cancer predisposition syndrome Fanconi anemia in depth revealed that mutant FANCA proteins engaged predominantly by HSP70 had severely compromised function. In contrast, the function of less severe mutants was preserved by a dominant increase in HSP90 binding. Reducing HSP90's buffering capacity with inhibitors or febrile temperatures destabilized HSP90-buffered mutants, exacerbating FA-related chemosensitivities. Strikingly, a compensatory FANCA somatic mutation from an "experiment of nature" in monozygotic twins both prevented anemia and reduced HSP90 binding. These findings provide one plausible mechanism for the variable expressivity and environmental sensitivity of genetic diseases.

Keywords: Fanconi anemia; HSP70; HSP90 buffering; cancer; gene-environment interaction.


Figures

Figure 1
Figure 1. Pattern of increased chaperone engagement reflects mutant severity across diverse human diseases
(A) Schematic protein-folding pathway modeling HSP70- or HSP90-bound client polypeptide conformations. HSP70 (blue) recognizes an extended hydrophobic (yellow) chain (unfolded client protein). HSP90 (red) recognizes structured polypeptides that are less hydrophobic (partially folded) with assistance from specialized co-chaperones (green). The fully folded, active state (folded) binds neither. (B) Schematic of LUMIER assays. HEK293T cells stably expressing Renilla luciferase-tagged fusions of the constitutive chaperones HSP90 (HSP90β) or HSP70 (HSPA8) (PREY) are transiently transfected with a library of plasmids encoding FLAG-tagged proteins (BAIT) (arrow 1). Bait proteins are captured by incubation of whole cell lysates on anti-FLAG antibody-coated plates. The relative amount of co-captured chaperone is measured by luciferase assays (arrow 2). Bait protein levels are subsequently measured by FLAG-ELISA to determine expression levels and calculate chaperone interaction scores. (C) Plot of chaperone interaction scores of 1628 missense mutants relative to the corresponding wild-type protein for HSP90 (x-axis) and HSP70 (y-axis) (dataset from (Sahni et al., 2015)). ∼ 22% of disease-causing mutants exhibit an increased interaction with HSP90 or HSP70 (area outside of the dashed lines). Literature curated clinical phenotypes of comparable mutants are grouped into severe, moderate or mild phenotypic classes. Severe: 1: SOD1-G41S; 3: GGCX-T591K; 7: AKR1D1-L106F, 9: GNAS-I103T. Moderate: 4: GGCX-W157R; 5: AAAS-S263P, 8: AKR1D1-P198L; 10: GNAS-A366S. Mild: 2: SOD1-G37R; 6: AAAS-L430F. (D) Correlation between reported clinical phenotype and the pattern of chaperone engagement of mutant proteins (HSP70-preferring: 70>90, compared to HSP90-preferring: 90≥70). Reported p value was determined by Fisher’s exact 2×3 extension test. See also Figure S1 and Table S1
Figure 2
Figure 2. Pattern of increased chaperone engagement reflects functional severity of FA-causing mutants
(A) Estimated frequency of inactivating mutations in FA genes across FA patients. (B) Distribution of LUMIER interaction scores for 90 FANCA variants normalized by the respective HSP90 (red area) or HSP70 (blue area) interaction scores of wild-type FANCA (mut/WT). (C) Scatter plot of differential (mut/WT) LUMIER interaction scores for 90 FANCA variants. HSP90 (red dots) and HSP70 (blue dots) interactions are parsed by their association with disease. Fractions of variants with significantly increased chaperone interaction compared to wild-type FANCA (%) are shown on the right for each category: p = 0.0095, HSP90; p = 0.0063, HSP70; determined by Fisher’s exact one-sided test. (D) Frequency of engagement patterns of HSP70 (70>90) or HSP90 (90≥70) chaperones with FANCA missense variants, grouped into FA-causing mutants (mutants) and polymorphisms of unknown significance (polymorphisms). Reported p value determined by Fisher’s exact one-sided test. (E) Scatter plot of differential LUMIER interaction z-scores for 38 FA-causing FANCA mutants versus HSP90 (x-axis) and HSP70 (y-axis) binding. 29 of 38 mutants (∼76%) exhibit increased binding to either chaperone (P1194L falls out of the indicated z-score range). Functionally characterized mutants are reported as “severe”, “moderate” or “mild” based on their functional severity. (F) Relative viability after exposure to mitomycin C (MMC) of GM6914 FANCA-null cells transduced with retroviruses encoding the indicated FANCA variants. (G) Correlation between pattern of chaperone engagement and observed cellular phenotypic severity of FANCA mutants. Reported p value determined by Fisher’s exact 2×3 extension test. See also Figure S2 and Table S2
Figure 3
Figure 3. Non-toxic, low-level HSP90 inhibition induces mutant-specific drug sensitivities
(A) Loss of viability (z-score) resulting from HSP90 inhibition (HSP90i; ganetespib, 5 nM) in FANCA-null GM6914 cells transduced with retroviruses encoding FANCA wild-type (squares; WT) or empty vector control (circles; null) in the presence (black symbols) of MMC (31.6nM) or DMSO control (grey symbols). Data from 3 independent experiments are presented as mean ± SEM. (B–C) Relative viability of GM6914 FANCA-null cells transduced with retroviruses encoding the indicated FANCA mutants, wild-type control (WT; black squares) or empty vector control (empty) in the presence of mitomycin C (MMC) under normal growth conditions (B) or low-level HSP90 inhibition (ganetespib, 5 nM) (C). Data presented as mean ± SEM from 2 independent experiments. Error-bars not visible are smaller in size than the symbol. (D) Screen for chemotherapeutics particularly toxic to FA. Highlighted drug treatment regimes (green diamonds) are significantly more toxic to FANCA-null GM6914 cells than to isogenic cells expressing wild-type FANCA. Black square indicates DMSO alone. (E) Mutant-specific chemo-sensitization by low-level HSP90 inhibition. Low-level HSP90 inhibition (ganetespib, 5 nM) sensitizes FANCA-null (GM6914) cells expressing the indicated FANCA mutants to diverse chemotherapeutic agents. Hierarchical clustering of significant relative sensitization effects of HSP90 inhibition (z-score >2) reveals two FANCA mutant clusters (HSP90-buffered mutants: red; non-buffered mutants: blue), on the basis of their differential sensitization to FA-related drugs (green cluster). HSP90 inhibition also induced sensitization to non-FA related drugs (purple cluster), but these effects were not mutant specific. See also Figure S3 and Table S3
Figure 4
Figure 4. Exposure to febrile-range temperatures phenocopies low-level HSP90 inhibition
(A–C) MMC sensitivity of FANCA-null GM6914 cell-lines expressing the indicated FANCA mutants recovering under normal conditions (DMSO control) (A), at a febrile-range temperature (39°C) (B), or in the presence of low-level HSP90 inhibition (ganetespib, 5 nM) (C). Data presented as mean ± SEM from 4 independent experiments; these experiments are distinct from those in Figure 3B–C. (D) Effect of low-level HSP90 inhibition (Gan: ganetespib, 5 nM O/N) vs. exposure to febrile-range temperatures on HSP70 or HSP90 levels in FANCA-null (GM6914) cell. Cells underwent transient (39°C 2h or 42°C 2h; including 11-hour recovery at 37°C to allow for HSP induction; heat-shock protein) or prolonged overnight (39°C) exposure. Both constitutive (C, upper band, Anti-HSC70) and inducible (I, lower band, Anti-HSP70) forms of HSP70 are indicated, compared to HSP90, as determined by Western blotting with specific antibodies. (E) Effects of low-level HSP90 inhibition (Gan: ganetespib, 5 nM vs. 39°C) on FANCD2 ubiquitylation in cells exposed to hydroxyurea (1 mM; 24 h). Samples from FANCA wild-type GM6914 cells were analyzed by Western blotting with antibodies against the indicated proteins. un indicates the unmodified FANCD2 protein, and ub the monoubiquitinated species. (F) Mutant-specific chemo-sensitization by temperature increase to febrile-range (39°C). Hierarchical clustering of significant relative sensitization by febrile-range temperatures (z-score >2) of FANCA-null (GM6914) cells expressing the indicated FANCA mutants reveals two FANCA mutant clusters (HSP90-buffered mutants: red; non-buffered mutants: blue) on the basis of their differential sensitization to FA-related drugs (green cluster). Febrile-range temperature also sensitized cells to non-FA related drugs (purple cluster), but these effects were not mutant-specific. See also Figure S4
Figure 5
Figure 5. Compensatory mutation prevents progression of anemia by restoring normal HSP90-dependence of FANCA protein
(A–C) Sensitivity to MMC of FANCA-null GM6914 cells expressing the indicated FANCA mutants. FANCA-Q/K encodes both the R880Q FA-causing mutation and the E966K compensatory mutation. Sensitization by pharmacological low-level HSP90 inhibition (ganetespib, 5 nM) (B) is compared to sensitization by febrile-range temperature (39°C) (C). Data presented as mean ± SEM from 4 independent experiments and obtained from the same experiment as Figures 4A–C; data for WT, R880Q and null were repeated here for comparison. (D) Differential chemosensitization of the indicated FANCA mutant cell-line pairs (R880Q vs. R880Q/E966K, Q – Q/K; R880Q/E966K vs. wild-type, Q/K – WT) by low-level HSP90 inhibition (HSP90i: ganetespib, 5 nM) and heat (39°C). Each point represents a different drug from Figure 3E. Dotted lines indicate significance thresholds (differential z-score >3 and <-3) in both biological replicates. Means are plotted. Arrows indicate mutant-specific sensitivities that are significantly different between single (Q, R880Q) and double (Q/K, R880Q/E966K) mutant cell-lines. (E) FANCD2 ubiquitylation in response to DNA replication stress (hydroxyurea, 1mM; 24h) is impaired in FANCA-R880Q but not FANCA-Q/K cells by low-level HSP90 inhibition (ganetespib, 5 nM; Gan) and increased temperatures (39°C or 40°C) as compared to DMSO controls (DMSO). un indicates the unmodified FANCD2 protein, and ub the monoubiquitinated species. (F) Differential LUMIER interaction scores of FANCA-R880Q mutant (x-axis) and FANCA-Q/K mutant (y-axis) as compared to wild-type FANCA. Specific FANCA partner proteins are indicated. (G) Differential LUMIER interaction scores for the indicated FANCA mutants relative to wild-type for binding to FAAP20, HSP90 and HSP70. Data presented as mean ± SEM from 4 independent experiments. (H) Cycloheximide (CHX) chase of the indicated FANCA mutant-expressing cells in the presence of hydoxyurea (1 mM). Samples were collected at the indicated time-points after CHX addition (20 µg/ml) and analyzed by Western for FANCA and HSP90. See also Figure S5 and Table S4

Comment in

References

    1. Adachi D, Oda T, Yagasaki H, Nakasato K, Taniguchi T, D’Andrea AD, Asano S, Yamashita T. Heterogeneous activation of the Fanconi anemia pathway by patient-derived FANCA mutants. Human molecular genetics. 2002;11:3125–3134. - PubMed
    1. Barrios-Rodiles M, Brown KR, Ozdamar B, Bose R, Liu Z, Donovan RS, Shinjo F, Liu Y, Dembowy J, Taylor IW, et al. High-throughput mapping of a dynamic signaling network in mammalian cells. Science. 2005;307:1621–1625. - PubMed
    1. Biesecker LG, Spinner NB. A genomic view of mosaicism and human disease. Nature reviews Genetics. 2013;14:307–320. - PubMed
    1. Borkovich KA, Farrelly FW, Finkelstein DB, Taulien J, Lindquist S. hsp82 is an essential protein that is required in higher concentrations for growth of cells at higher temperatures. Molecular and cellular biology. 1989;9:3919–3930. - PMC - PubMed
    1. Burga A, Casanueva MO, Lehner B. Predicting mutation outcome from early stochastic variation in genetic interaction partners. Nature. 2011;480:250–253. - PubMed

Publication types

MeSH terms

Substances