. 2017 Mar 7;25(3):622-634.
doi: 10.1016/j.cmet.2017.01.009. Epub 2017 Feb 16.

Converting Adult Pancreatic Islet α Cells into β Cells by Targeting Both Dnmt1 and Arx

Affiliations

Converting Adult Pancreatic Islet α Cells into β Cells by Targeting Both Dnmt1 and Arx

Harini Chakravarthy et al. Cell Metab. .

Abstract

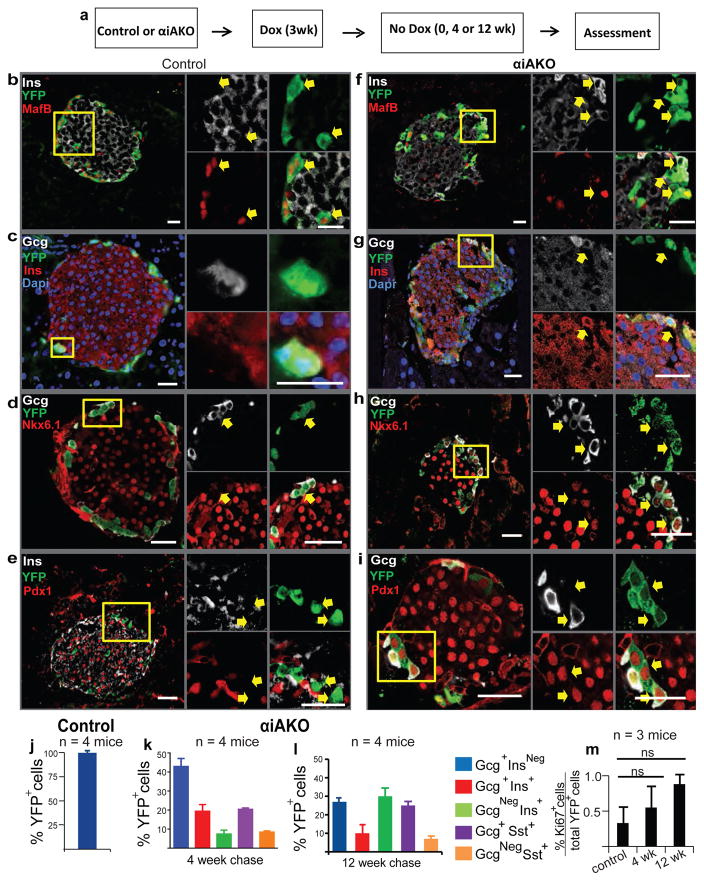
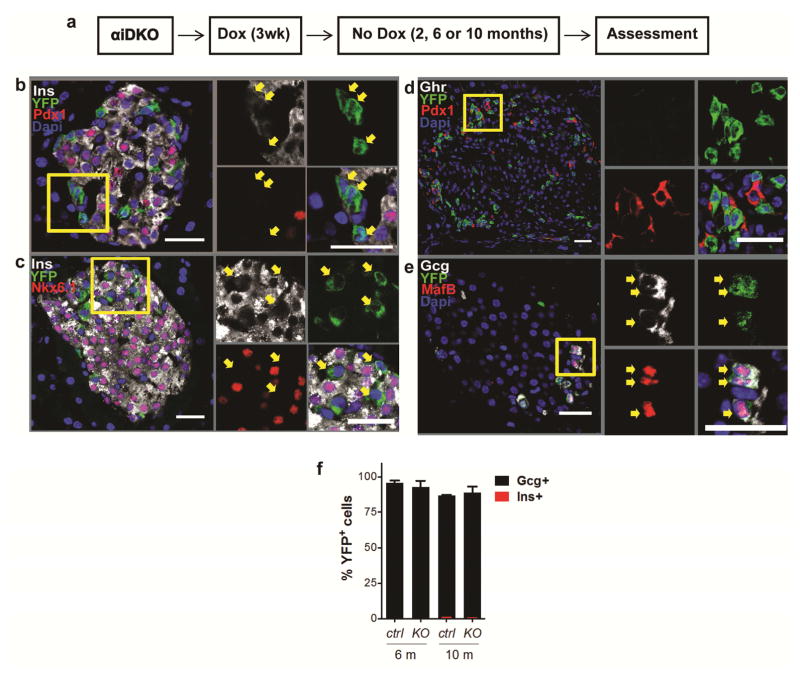
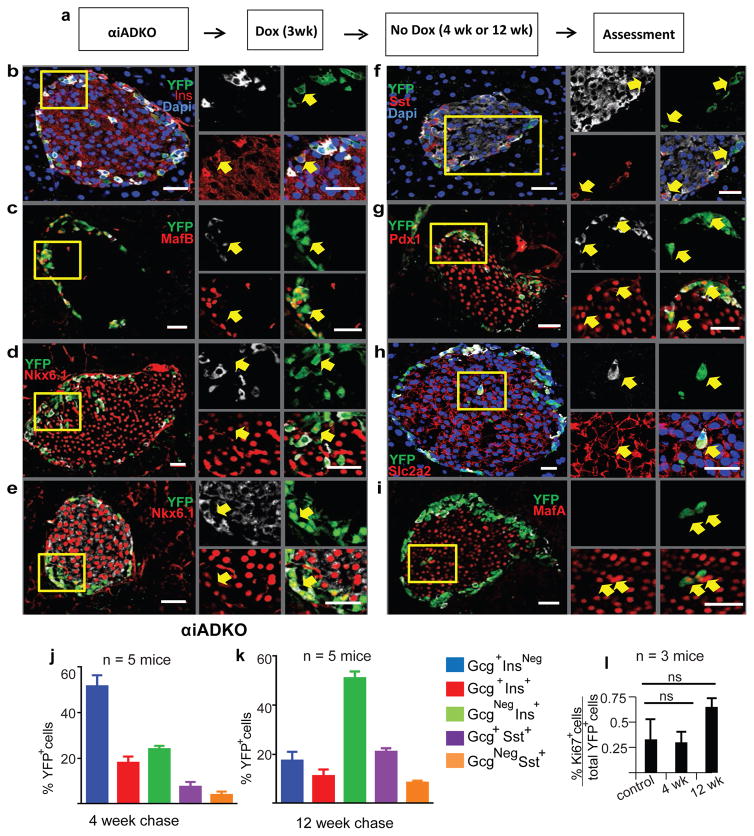
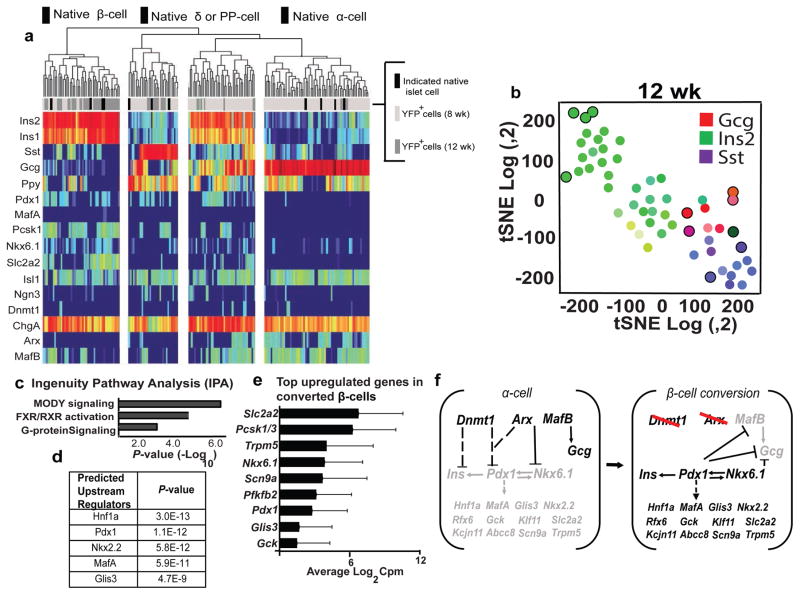
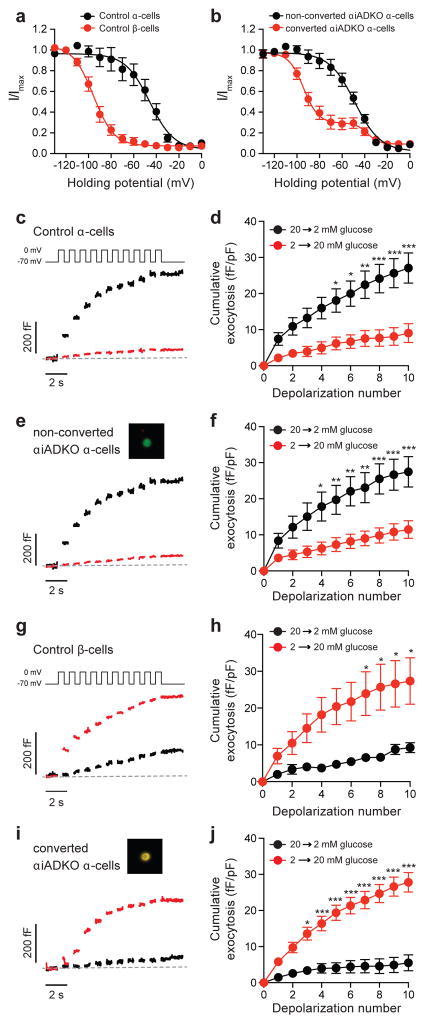
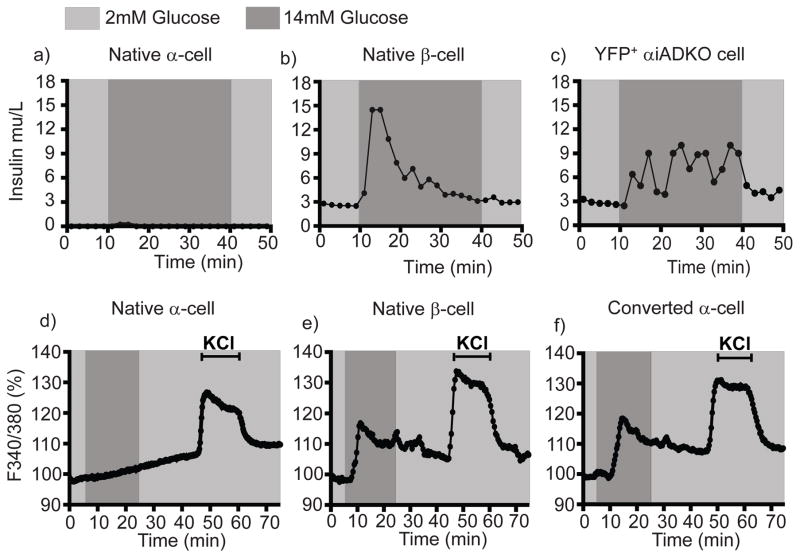
Insulin-producing pancreatic β cells in mice can slowly regenerate from glucagon-producing α cells in settings like β cell loss, but the basis of this conversion is unknown. Moreover, it remains unclear if this intra-islet cell conversion is relevant to diseases like type 1 diabetes (T1D). We show that the α cell regulators Aristaless-related homeobox (Arx) and DNA methyltransferase 1 (Dnmt1) maintain α cell identity in mice. Within 3 months of Dnmt1 and Arx loss, lineage tracing and single-cell RNA sequencing revealed extensive α cell conversion into progeny resembling native β cells. Physiological studies demonstrated that converted α cells acquire hallmark β cell electrophysiology and show glucose-stimulated insulin secretion. In T1D patients, subsets of glucagon-expressing cells show loss of DNMT1 and ARX and produce insulin and other β cell factors, suggesting that DNMT1 and ARX maintain α cell identity in humans. Our work reveals pathways regulated by Arx and Dnmt1 that are sufficient for achieving targeted generation of β cells from adult pancreatic α cells.


Figures

Figure 1
Figure 1. Loss of α-cell identity after deletion of Arx
(a) Schematic showing experimental design for Dox treatment of knock out and control animals. (b–i) Immunostaining showing expression of α and β-cell markers MafB, Ins, Gcg, Nkx6.1, Pdx1 with YFP in control and αiAKO mice 4 weeks after Dox treatment. Yellow boxes show specific area of islet enlarged and represented by arrows on the right to demonstrate gene expression within specific cells or sets of cells. Scale bars represent 25 μm. (j–l) Quantification of α-to-β-cell conversion in control mice at the end of 3 weeks of Dox treatment (Time 0) (j) and αiAKO mice at the end of a 4 week chase and 12 week chase (k,l). (m) Quantification of Ki67+ YFP+ cells at the end of a 4 week chase and 12 week chase compared to controls (N=3 mice). Bar graph data are represented as mean ± S.D. Dox, Doxycycline. N=4 mice per time point.
Figure 2
Figure 2. α-cells maintain their fate in the absence of Dnmt1
(a) Schematic showing experimental design for Dox treatment of knock out and control animals. (b–e) Immunostaining showing expression of α, β, δ, and ε-cell markers Gcg, MafB, Ins, Pdx1, Nkx6.1, Sst, and Ghrelin with YFP in αiDKO mice 10 months after Dox treatment. Yellow boxes show specific area of islet enlarged and represented by arrows on the right to demonstrate gene expression within specific cells or sets of cells. Scale bars represent 25 μm. (f) Percentage of YFP+ cells that express glucagon or insulin in knockout and control mice. Bar graph data are represented as mean ± S.D. Dox, Doxycycline. N=4 mice per time point.
Figure 3
Figure 3. Expression of β-cell genes in murine α-cells lacking Dnmt1 and Arx
(a) Schematic showing experimental design for Dox treatment of knock out and control animals. (b–i) Immunostaining showing expression of α, β, and δ-cell markers Ins, Gcg, MafB, Nkx6.1, Sst, Pdx1, Slc2a2 and MafA with YFP in αiADKO mice 12 weeks after Dox treatment. Yellow boxes show specific area of islet enlarged and represented by arrows on the right to demonstrate gene expression within specific cells or sets of cells. Scale bars represent 25 μm. (j–k) Quantification of α-to-β-cell conversion in αiADKO mice at the end of a 4 week chase and 12 week chase. (l) Quantification of Ki67+ YFP+ cells at the end of a 4 week chase and 12 week chase compared to controls (N=3 mice). Bar graph data are represented as mean ± S.D. Dox, Doxycycline. N=4 mice per time point.
Figure 4
Figure 4. Single Cell RNA-Seq analysis of mouse α-cells undergoing loss of identity
(a) Heat map generated from single cells obtained from two αiADKO mice 8 and 12 weeks after Dnmt1 and Arx deletion (N=2 mice). Black bars represent normal islet cells, light grey and dark grey bars represent individual YFP+ cells obtained from αiADKO mice at the 8 week and 12 week time-points respectively. (b) tSNE plot generated from single cells obtained from αiADKO mice 12 weeks after Dnmt1 and Arx deletion. Black circles represent normal islet cells. Green circles represent individual YFP+ cells obtained from αiADKO mice. The color inside each circle indicates whether the cell expressed Gcg (red), Ins (green) or Sst (Purple). Intermediate colors represent intermediate cell states. (c,d) Key predicted pathways and gene regulators generated by Ingenuity Pathway Analysis (IPA) comparing single cells obtained from αiADKO mice 8 weeks and 12 weeks after Dnmt1 and Arx deletion, and progressing from an α-cell state to a β-cell state. (e) Top upregulated genes in converted α-cells represented as the average of log2 counts per million (Cpm) values from single cells expressing Insulin alone obtained from αiADKO mice at the 12 week time-point. The average Insulin expression in these cells is 16.1 (±0.37) cpm. (f) A model for activation of a β-cell gene regulatory network in cells undergoing α-to-β-cell conversion. Dashed lines and arrows represent indirect transcriptional relationships between regulators and targets. Solid lines and arrows represent established direct transcriptional relationships between regulators and targets. Repressed genes are in grey font, while induced genes are in black font.
Figure 5
Figure 5. Electrophysiological properties of converted α-cells
(a) Voltage-dependent inactivation of Na+ channels is left-shifted in control β-cells (red; n=9) compared with control α-cells (black; n=13). Total mice = 3. (b) Inactivation of Na+ currents in non-converted (InsNeg,YFP+) αiADKO α-cells (black; n=21, mice = 3) was identical to the control α-cells, while the majority (~70%) of Na+ current inactivation in the converted (Ins+,YFP+) αiADKO β-cells (red; n=27, mice = 3) was left-shifted similar to that observed in β-cells. (c–j) Single-cell exocytosis was measured by monitoring capacitance increases in response to a series of membrane depolarizations following transition from 20 to 2 mM glucose (black) or from 2 to 20 mM glucose (red). Representative traces (c,e,g) and averaged data (d,f,h) are shown. In control α-cells (c,d), exocytosis was amplified by lowering glucose (n=21, mice = 2) and suppressed by raising glucose (n=16, mice = 2). Identical results were observed (e,f) in non-converted (InsNeg,YFP+; inset) αiADKO α-cells (n=13 and 24, mice = 3). In control β-cells (g,h), exocytotic response was amplified by raising glucose (n=8) and suppressed by lowering glucose (n=6, mice=2). In converted (i,j; Ins+,YFP+ ; inset) αiADKO α-cells, however, the response was reversed to recapitulate a β-cell phenotype such that raising glucose amplified the exocytotic response (n=23, mice = 3) while lowering glucose suppressed it (n=14). * P<0.05; ** P<0.01; *** P>0.001.
Figure 6
Figure 6. Insulin secretion and Calcium signaling properties of converted α-cells
(a–c) Temporal insulin secretion profiles of 5000 YFP+ cells from Glucagon-Venus mice (N=3 mice) (a), MIP-GFP mice (N=3 mice) (b) and αiADKO mice (N=4 mice) (c) perfused with basal (2mM Glucose) and stimulatory (14mM Glucose) at the indicated time-points. (d–f) Intracellular calcium profiles indicated by Fura-2 ratio of the fluorescence intensities (340/380nm) of Venus+ cells and GFP+ from Glucagon-Venus mice (N=3 mice) (d), MIP-GFP mice (N=3 mice) (e), and αiADKO mice (N=5 mice) (f) perfused with basal (2mM Glucose) and stimulatory (14mM Glucose or 30mM KCl) solutions at the indicated time-points. In a–f, cells are FACS-purified from the indicated mice.

Comment in

References

    1. Adewola AF, Lee D, Harvat T, Mohammed J, Eddington DT, Oberholzer J, Wang Y. Microfluidic perifusion and imaging device for multi-parametric islet function assessment. Biomed Microdevices. 2010;12(3):409–17. - PubMed
    1. Arda HE, Li L, Tsai J, Torre EA, Rosli Y, Peiris H, Spitale RC, Dai C, Gu X, Qu K, Wang P, Wang J, Grompe M, Scharfmann R, Snyder MS, Bottino R, Powers AC, Chang HY, Kim SK. Age-dependent pancreatic gene regulation reveals mechanisms governing human β-cell function. Cell Metab. 2016;23(5):909–20. - PMC - PubMed
    1. Akinci E, Banga A, Greder LV, Dutton JR, Slack JM. Reprogramming of pancreatic exocrine cells towards a beta (β) cell character using Pdx1, Ngn3 and MafA. Biochem J. 2012;442(3):539–550. - PMC - PubMed
    1. Anders S, Pyl PT, Huber W. HT-Seq – a Python framework to work with high-throughput sequencing data. Bioinformatics. 2015;31(2):166–169. - PMC - PubMed
    1. Anderson RM, et al. Loss of Dnmt1 catalytic activity reveals multiple roles for DNA methylation during pancreas development and regeneration. Dev Biol. 2009;334(1):213–23. - PMC - PubMed

MeSH terms