

BLINKER: Automated Extraction of Ocular Indices from EEG Enabling Large-Scale Analysis
- PMID: 28217081
- PMCID: PMC5289990
- DOI: 10.3389/fnins.2017.00012
BLINKER: Automated Extraction of Ocular Indices from EEG Enabling Large-Scale Analysis
Abstract
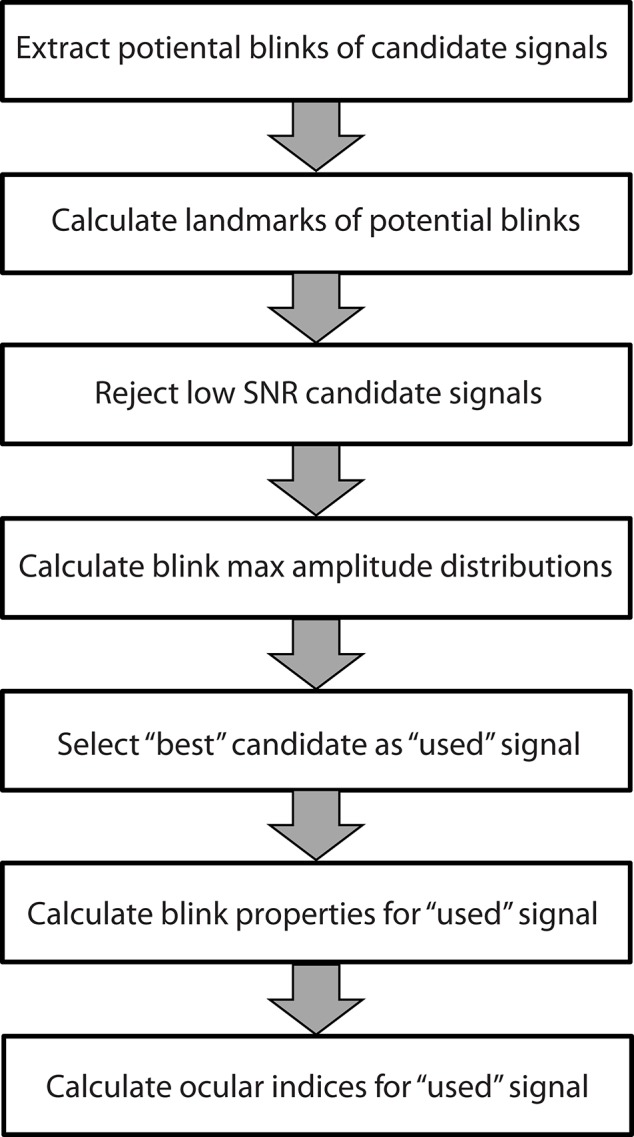
Electroencephalography (EEG) offers a platform for studying the relationships between behavioral measures, such as blink rate and duration, with neural correlates of fatigue and attention, such as theta and alpha band power. Further, the existence of EEG studies covering a variety of subjects and tasks provides opportunities for the community to better characterize variability of these measures across tasks and subjects. We have implemented an automated pipeline (BLINKER) for extracting ocular indices such as blink rate, blink duration, and blink velocity-amplitude ratios from EEG channels, EOG channels, and/or independent components (ICs). To illustrate the use of our approach, we have applied the pipeline to a large corpus of EEG data (comprising more than 2000 datasets acquired at eight different laboratories) in order to characterize variability of certain ocular indicators across subjects. We also investigate dependence of ocular indices on task in a shooter study. We have implemented our algorithms in a freely available MATLAB toolbox called BLINKER. The toolbox, which is easy to use and can be applied to collections of data without user intervention, can automatically discover which channels or ICs capture blinks. The tools extract blinks, calculate common ocular indices, generate a report for each dataset, dump labeled images of the individual blinks, and provide summary statistics across collections. Users can run BLINKER as a script or as a plugin for EEGLAB. The toolbox is available at https://github.com/VisLab/EEG-Blinks. User documentation and examples appear at http://vislab.github.io/EEG-Blinks/.
Keywords: EEG; EEGLAB; artifact; big data; blink duration; eye blinks; human behavior; machine learning.
Figures
Similar articles
-
MOBBED: a computational data infrastructure for handling large collections of event-rich time series datasets in MATLAB.Front Neuroinform. 2013 Oct 10;7:20. doi: 10.3389/fninf.2013.00020. eCollection 2013. Front Neuroinform. 2013. PMID: 24124417 Free PMC article.
-
Online Automatic Artifact Rejection using the Real-time EEG Source-mapping Toolbox (REST).Annu Int Conf IEEE Eng Med Biol Soc. 2018 Jul;2018:106-109. doi: 10.1109/EMBC.2018.8512191. Annu Int Conf IEEE Eng Med Biol Soc. 2018. PMID: 30440352
-
The PREP pipeline: standardized preprocessing for large-scale EEG analysis.Front Neuroinform. 2015 Jun 18;9:16. doi: 10.3389/fninf.2015.00016. eCollection 2015. Front Neuroinform. 2015. PMID: 26150785 Free PMC article.
-
Detection of eye blink artifacts from single prefrontal channel electroencephalogram.Comput Methods Programs Biomed. 2016 Feb;124:19-30. doi: 10.1016/j.cmpb.2015.10.011. Epub 2015 Oct 26. Comput Methods Programs Biomed. 2016. PMID: 26560852
-
Automated protocol for evaluation of electromagnetic component separation (APECS): Application of a framework for evaluating statistical methods of blink extraction from multichannel EEG.Clin Neurophysiol. 2007 Jan;118(1):80-97. doi: 10.1016/j.clinph.2006.07.317. Epub 2006 Oct 24. Clin Neurophysiol. 2007. PMID: 17064960
Cited by
-
A Video-Based Technique for Heart Rate and Eye Blinks Rate Estimation: A Potential Solution for Telemonitoring and Remote Healthcare.Sensors (Basel). 2021 Feb 25;21(5):1607. doi: 10.3390/s21051607. Sensors (Basel). 2021. PMID: 33668921 Free PMC article.
-
Dopamine supports idea originality: the role of spontaneous eye blink rate on divergent thinking.Psychol Res. 2023 Feb;87(1):17-27. doi: 10.1007/s00426-022-01658-y. Epub 2022 Feb 10. Psychol Res. 2023. PMID: 35141768 Free PMC article.
-
Joint Analysis of Eye Blinks and Brain Activity to Investigate Attentional Demand during a Visual Search Task.Brain Sci. 2021 Apr 28;11(5):562. doi: 10.3390/brainsci11050562. Brain Sci. 2021. PMID: 33925209 Free PMC article.
-
Experience with opioids does not modify the brain network involved in expectations of placebo analgesia.Eur J Neurosci. 2022 Apr;55(7):1840-1858. doi: 10.1111/ejn.15645. Epub 2022 Mar 22. Eur J Neurosci. 2022. PMID: 35266226 Free PMC article.
-
Synchronization-based fusion of EEG and eye blink signals for enhanced decoding accuracy.Sci Rep. 2024 Nov 6;14(1):26918. doi: 10.1038/s41598-024-78542-9. Sci Rep. 2024. PMID: 39506076 Free PMC article.
References
-
- Benedetto S., Pedrotti M., Minin L., Baccino T., Re A., Montanari R. (2011). Driver workload and eye blink duration. Transport. Res. Part F Traffic Psychol. Behav. 14, 199–208. 10.1016/j.trf.2010.12.001 - DOI
Grants and funding
LinkOut - more resources
Full Text Sources
Other Literature Sources
Molecular Biology Databases