Review
. 2017 Feb 3:8:117.
doi: 10.3389/fpls.2017.00117. eCollection 2017.

Reshaping Plant Biology: Qualitative and Quantitative Descriptors for Plant Morphology

Affiliations
Review

Reshaping Plant Biology: Qualitative and Quantitative Descriptors for Plant Morphology

Mathilde Balduzzi et al. Front Plant Sci. .

Abstract

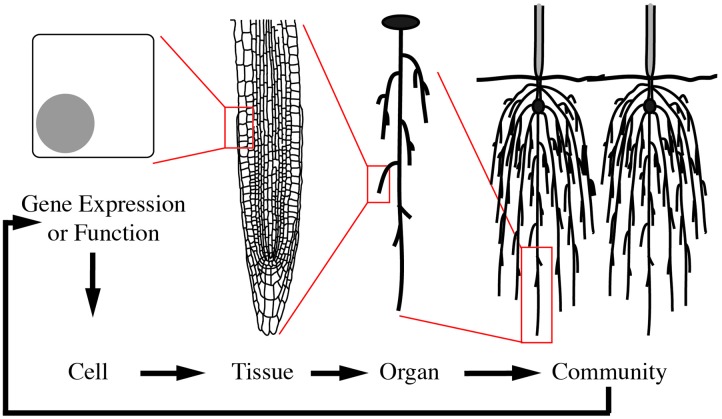
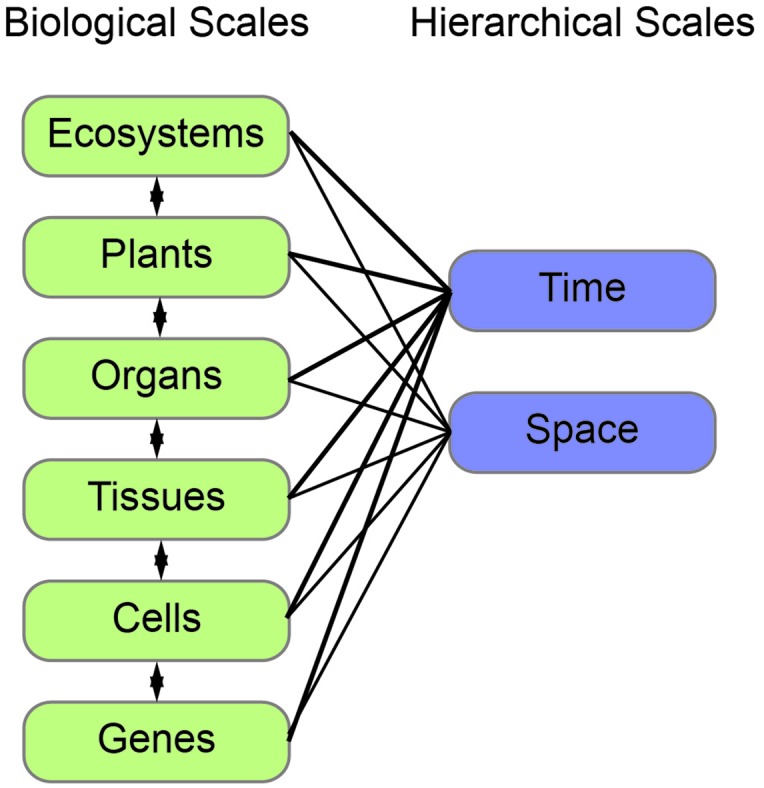
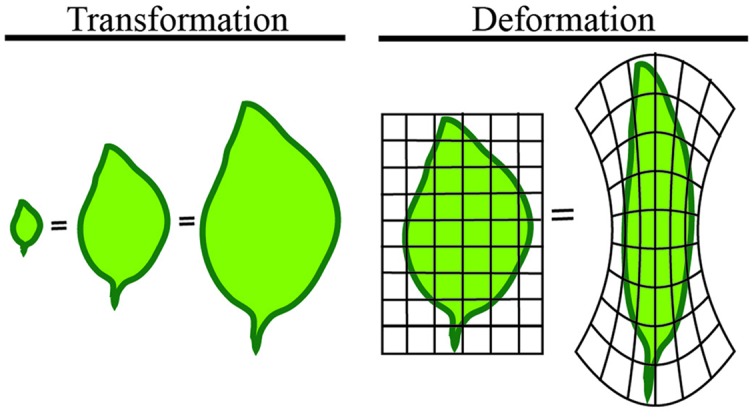
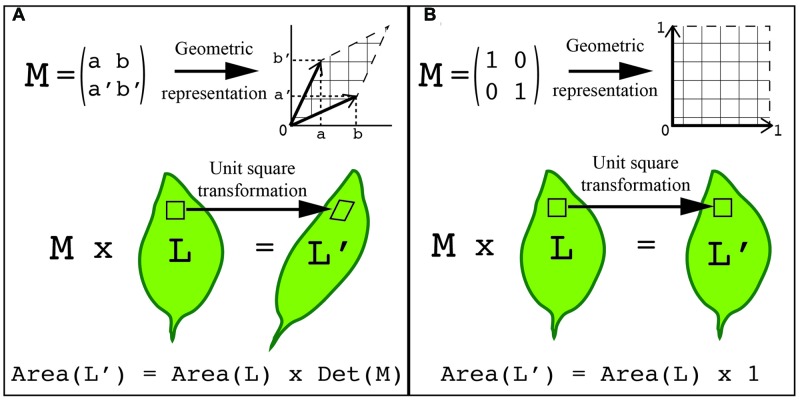
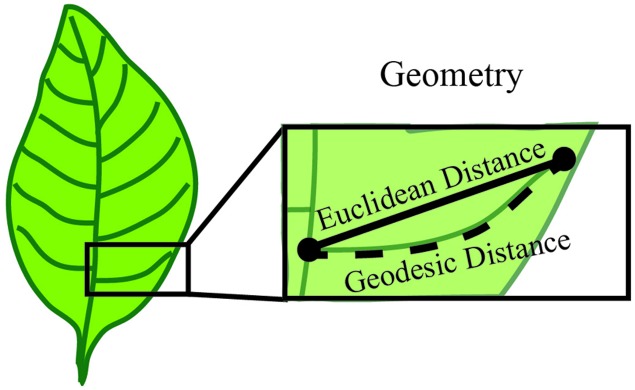
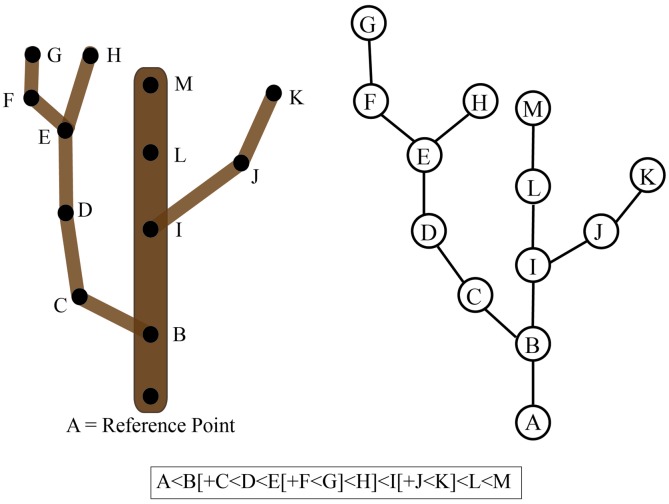
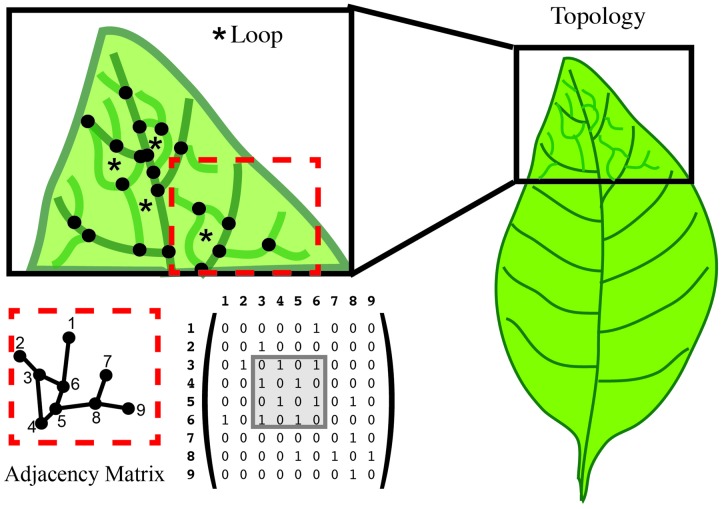
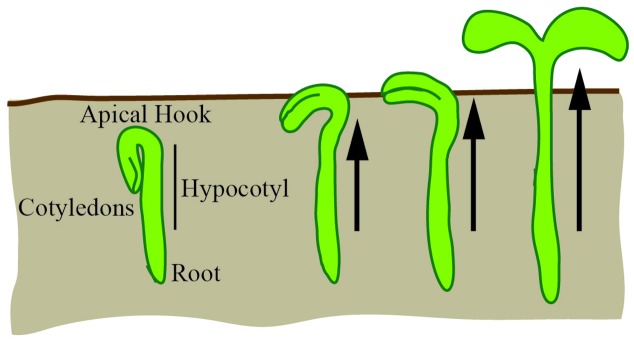
An emerging challenge in plant biology is to develop qualitative and quantitative measures to describe the appearance of plants through the integration of mathematics and biology. A major hurdle in developing these metrics is finding common terminology across fields. In this review, we define approaches for analyzing plant geometry, topology, and shape, and provide examples for how these terms have been and can be applied to plants. In leaf morphological quantifications both geometry and shape have been used to gain insight into leaf function and evolution. For the analysis of cell growth and expansion, we highlight the utility of geometric descriptors for understanding sepal and hypocotyl development. For branched structures, we describe how topology has been applied to quantify root system architecture to lend insight into root function. Lastly, we discuss the importance of using morphological descriptors in ecology to assess how communities interact, function, and respond within different environments. This review aims to provide a basic description of the mathematical principles underlying morphological quantifications.

Keywords: ecology; geometry; hypocotyl; leaf; morphology; roots; sepal; topology.


Figures

FIGURE 1
FIGURE 1
Morphological changes are mediated through cyclic multi-scale signals and transformations. A multi-scale morphology transformation is illustrated by neighbor detection between root systems. Morphological changes are initiated through developmental or environmental cues that induce changes in gene expression or function. These alterations lead to local changes at the cellular-level, which are then translated to the tissue- and organ-level. Organ-level changes then lead to an altered community. The community and environmental signals then feedback to mediate gene expression or functional changes in a continuous loop.
FIGURE 2
FIGURE 2
The interconnection of biological and hierarchical scales. Plant morphology can be measured and modeled at different biological (left, green) and hierarchical (right, blue) scales. Each of the biological scales influences the next and can be measured in both space and time.
FIGURE 3
FIGURE 3
Shape is independent of transformation or deformation. The least intuitive quantification of morphology is shape. Shape refers to measures that are independent of transformation or deformation. The above leaves are all considered the same mathematical shape, despite dramatically different appearances.
FIGURE 4
FIGURE 4
Using transformations to quantify shape. The points on the surface of an object can be represented with defined coordinates. These points can then be transformed by applying a transformation matrix. (A) A generalized representation of applying a transformation matrix to quantify shape. (B) An example of a unit transformation for shape changes. (A,B) In both examples, a 2x2 transformation matrix, M, can be visualized as a table of two column vectors (top left) or by geometric representation (top right). This same transformation can be visualized on a leaf. Each unit square that composes the organ surface can be transformed into the geometric shape associated with the transformation matrix (middle). The total area of the transformed organ is equal to the original leaf area times the transformation matrix determinant, which is the area formed by the two vectors (bottom). In the unit transformation matrix example, the matrix determinant, Det (M), is equal to 1.
FIGURE 5
FIGURE 5
Geometry establishes measurable sizes of the plant organ surface. Geometry can be used to define parameters such as length, diameter and angle between features. In this example, the features are represented by the start and end of a vein branch (black dots). The distance between these two points can be described by the Euclidean distance, which is obtained by a straight line between two points. Alternatively, the shortest path along the branch surface between points, or Geodesic distance can be used to define length. Both of these are a valid measure of length and one common metric of geometry is the difference between these two measurements.
FIGURE 6
FIGURE 6
Connectivity of a tree branch can be represented as a graph or a character chain. Consider the tree on the left. The reference point was chosen as the base of this main branch (A). Each branch point is represented as a node (B-K) in the graph on the right relative to the reference point A. Alternatively, branch connectivity can be represented as a character chain, where the C < D relationship indicates that C is closer to the reference point (A) than D and B[+C] indicates that C is a child branch originating from the parent B.
FIGURE 7
FIGURE 7
Topology characterizes the relationship between features. In this leaf vein example, features are defined as the junction of branches (black dots). Topology can calculate the number of loops (asterisk in the upper left), and the number of junctions forming that loop. An adjacency matrix that defines the connection between two features can be used to represent these data. The connection between features is represented in a numerical matrix. Connected features are represented by a “1” in the adjacency matrix. Loops can be visualized within the matrix (gray box).
FIGURE 8
FIGURE 8
The hypocotyl is a model for cellular expansion and growth. In the dark, under the soil, the hypocotyl forms an apical hook. As the hypocotyl expands and grows toward the light, the hook expands to unfurl the cotyledons. Hypocotyl growth is driven by unidirectional cellular expansion (arrows).
FIGURE 9
FIGURE 9
The morphology of sepals and their epidermal cells. Wild-type Arabidopsis thaliana sepals decrease the width/length ratio as they grow. Sepal epidermal cells are highly variable in morphology, with giant pavement cells () interspersed between smaller cells in a large range of sizes.

References

    1. Abramoff M. D., Magalhães P. J., Ram S. J. (2004). Image processing with ImageJ. Biophotonics Int. 11 36–42.
    1. Armengaud P., Zambaux K., Hills A., Sulpice R., Pattison R. J., Blatt M. R., et al. (2009). EZ-Rhizo: integrated software for the fast and accurate measurement of root system architecture. Plant J. 57 945–956. 10.1111/j.1365-313X.2008.03739.x - DOI - PubMed
    1. Auger S., Shipley B. (2012). Inter-specific and intra-specific trait variation along short environmental gradients in an old-growth temperate forest. J. Veg. Sci. 24 419–428. 10.1111/j.1654-1103.2012.01473.x - DOI
    1. Bailey J. K., Hendry A. P., Kinnison M. T., Post D. M., Palkovacs E. P., Pelletier F., et al. (2009a). From genes to ecosystems: an emerging synthesis of eco-evolutionary dynamics. New Phytol. 184 746–749. 10.1111/j.1469-8137.2009.03081.x - DOI - PubMed
    1. Bailey J. K., Schweitzer J. A., Ubeda F., Koricheva J., LeRoy C. J., Madritch M. D., et al. (2009b). From genes to ecosystems: a synthesis of the effects of plant genetic factors across levels of organization. Philos. Trans. R. Soc. B 364 1607–1616. 10.1098/rstb.2008.0336 - DOI - PMC - PubMed

LinkOut - more resources