

Glioma Cell Invasion is Significantly Enhanced in Composite Hydrogel Matrices Composed of Chondroitin 4- and 4,6-Sulfated Glycosaminoglycans
- PMID: 28217304
- PMCID: PMC5312825
- DOI: 10.1039/C6TB01083K
Glioma Cell Invasion is Significantly Enhanced in Composite Hydrogel Matrices Composed of Chondroitin 4- and 4,6-Sulfated Glycosaminoglycans
Abstract
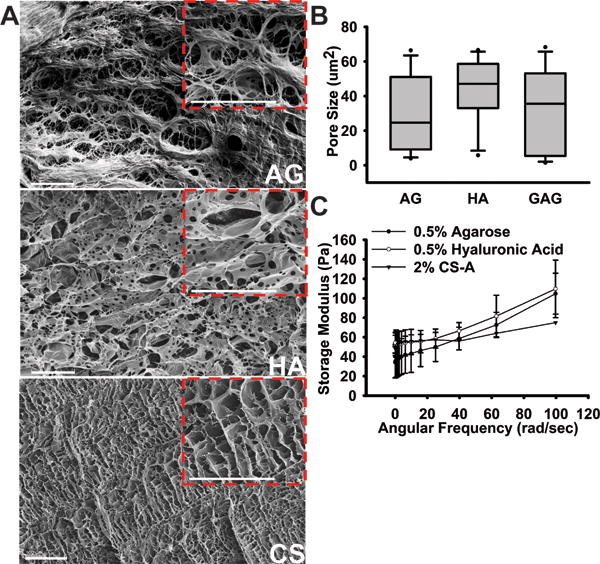
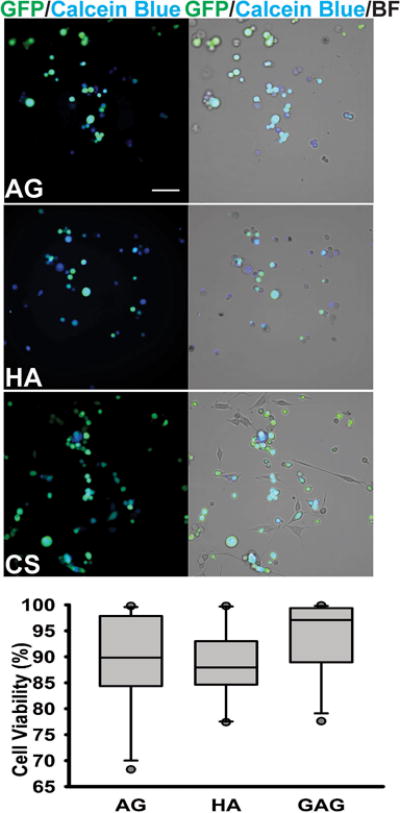
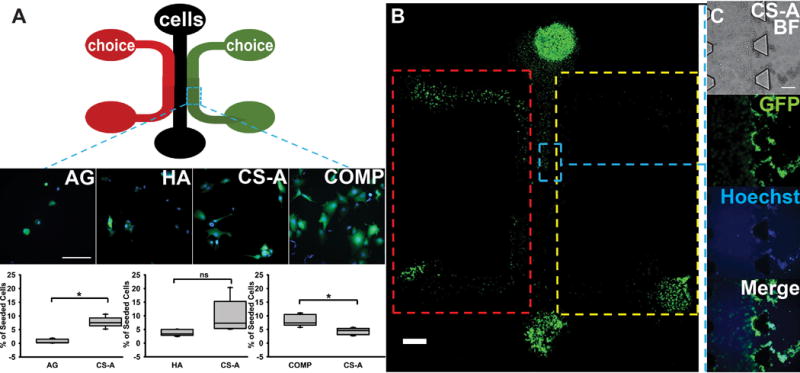
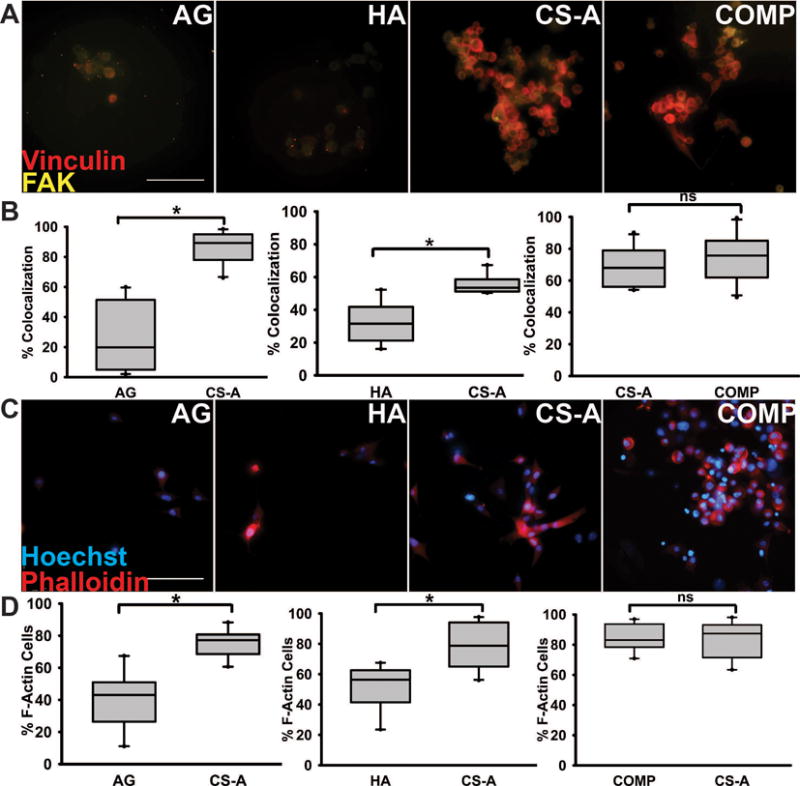
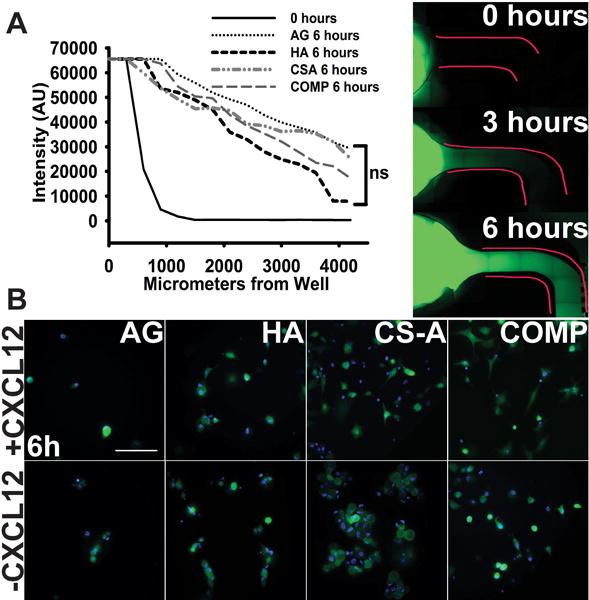
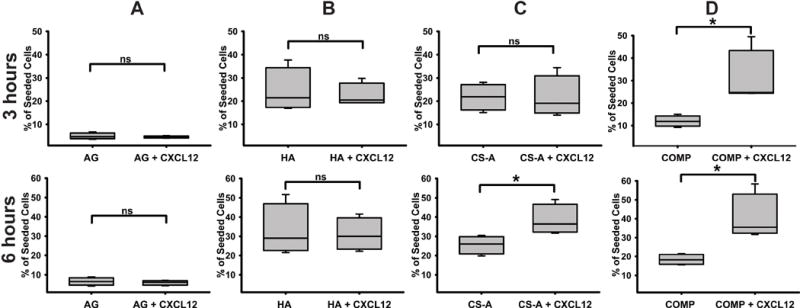
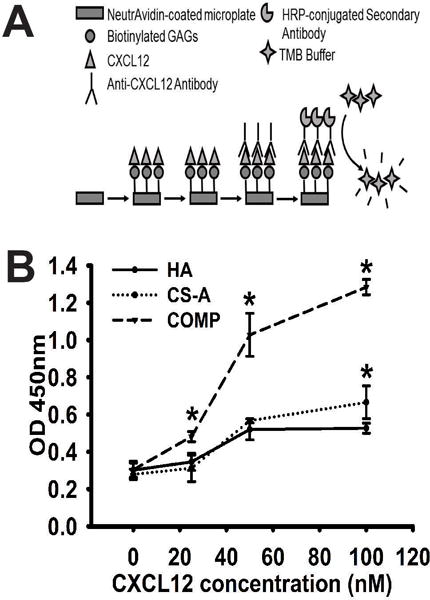
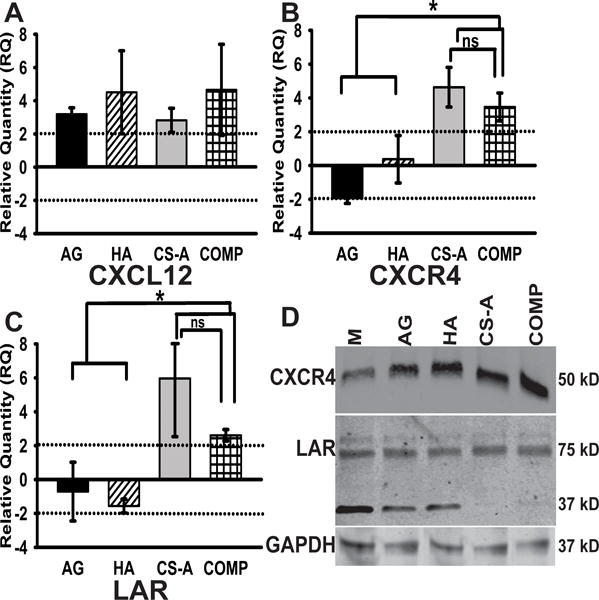
Glioblastoma multiforme (GBM) is the most aggressive form of astrocytoma accounting for a majority of primary malignant brain tumors in the United States. Chondroitin sulfate proteoglycans (CSPGs) and their glycosaminoglycan (GAG) side chains are key constituents of the brain extracellular matrix (ECM) implicated in promoting tumor invasion. However, the mechanisms by which sulfated CS-GAGs promote brain tumor invasion are currently unknown. We hypothesize that glioma cell invasion is triggered by the altered sulfation of CS-GAGs in the tumor extracellular environment, and that this is potentially mediated by independent mechanisms involving CXCL12/CXCR4 and LAR signaling respectively. This was tested in vitro by encapsulating the human glioma cell line U87MG-EGFP into monosulfated (4-sulfated; CS-A), composite (4 and 4,6-sulfated; CS-A/E), unsulfated hyaluronic acid (HA), and unsulfated agarose (AG; polysaccharide) hydrogels within microfluidics-based choice assays. Our results demonstrated the enhanced preferential cell invasion into composite hydrogels, when compared to other hydrogel matrices (p<0.05). Haptotaxis assays demonstrated the significantly (p<0.05) faster migration of U87MG-EGFP cells in CXCL12 containing CS-GAG hydrogels when compared to other hydrogel matrices containing the same chemokine concentration. This is likely due to the significantly (p<0.05) greater affinity of composite CS-GAGs to CXCL12 over other hydrogel matrices. Results from qRT-PCR assays further demonstrated the significant (p<0.05) upregulation of the chemokine receptor CXCR4, and the CSPG receptor LAR in glioma cells within CS-GAG hydrogels compared to control hydrogels. Western blot analysis of cell lysates derived from glioma cells encapsulated in different hydrogel matrices further corroborate qRT-PCR results, and indicate the presence of a potential variant of LAR that is selectively expressed only in glioma cells encapsulated in CS-GAG hydrogels. These results suggest that sulfated CS-GAGs may directly induce enhanced invasion and haptotaxis of glioma cells associated with aggressive brain tumors via distinct mechanisms.
Keywords: Glioblastoma; chondroitin sulfate glycosaminoglycans; haptotaxis; invasion.
Figures
Similar articles
-
Surfen-mediated blockade of extratumoral chondroitin sulfate glycosaminoglycans inhibits glioblastoma invasion.FASEB J. 2019 Nov;33(11):11973-11992. doi: 10.1096/fj.201802610RR. Epub 2019 Aug 9. FASEB J. 2019. PMID: 31398290 Free PMC article.
-
Chondroitin Sulfate Glycosaminoglycan Hydrogels Create Endogenous Niches for Neural Stem Cells.Bioconjug Chem. 2015 Dec 16;26(12):2336-49. doi: 10.1021/acs.bioconjchem.5b00397. Epub 2015 Oct 20. Bioconjug Chem. 2015. PMID: 26440046
-
Chondroitin sulfate, dermatan sulfate, and hyaluronic acid differentially modify the biophysical properties of collagen-based hydrogels.Acta Biomater. 2024 Jan 15;174:116-126. doi: 10.1016/j.actbio.2023.12.018. Epub 2023 Dec 14. Acta Biomater. 2024. PMID: 38101556 Free PMC article.
-
Biosynthesis and function of chondroitin sulfate.Biochim Biophys Acta. 2013 Oct;1830(10):4719-33. doi: 10.1016/j.bbagen.2013.06.006. Epub 2013 Jun 14. Biochim Biophys Acta. 2013. PMID: 23774590 Review.
-
Radiation Effects on Brain Extracellular Matrix.Front Oncol. 2020 Oct 2;10:576701. doi: 10.3389/fonc.2020.576701. eCollection 2020. Front Oncol. 2020. PMID: 33134175 Free PMC article. Review.
Cited by
-
The scrambled story between hyaluronan and glioblastoma.J Biol Chem. 2021 Jan-Jun;296:100549. doi: 10.1016/j.jbc.2021.100549. Epub 2021 Mar 17. J Biol Chem. 2021. PMID: 33744285 Free PMC article. Review.
-
Progress in mimicking brain microenvironments to understand and treat neurological disorders.APL Bioeng. 2021 Apr 8;5(2):020902. doi: 10.1063/5.0043338. eCollection 2021 Jun. APL Bioeng. 2021. PMID: 33869984 Free PMC article.
-
Surfen-mediated blockade of extratumoral chondroitin sulfate glycosaminoglycans inhibits glioblastoma invasion.FASEB J. 2019 Nov;33(11):11973-11992. doi: 10.1096/fj.201802610RR. Epub 2019 Aug 9. FASEB J. 2019. PMID: 31398290 Free PMC article.
-
Role of Microenvironment in Glioma Invasion: What We Learned from In Vitro Models.Int J Mol Sci. 2018 Jan 4;19(1):147. doi: 10.3390/ijms19010147. Int J Mol Sci. 2018. PMID: 29300332 Free PMC article. Review.
-
Perspective on Translating Biomaterials Into Glioma Therapy: Lessons From in vitro Models.Front Mater. 2018 May;5:27. doi: 10.3389/fmats.2018.00027. Epub 2018 May 9. Front Mater. 2018. PMID: 30911536 Free PMC article.
References
-
- Giese A, Bjerkvig R, Berens ME, Westphal M. J Clin Oncol. 2003;21:1624–1636. - PubMed
Grants and funding
LinkOut - more resources
Full Text Sources
Other Literature Sources
Miscellaneous