. 2017 Feb 15;2(1):e00009-17.
doi: 10.1128/mSphere.00009-17. eCollection 2017 Jan-Feb.

Transcriptome-Level Signatures in Gene Expression and Gene Expression Variability during Bacterial Adaptive Evolution

Affiliations

Transcriptome-Level Signatures in Gene Expression and Gene Expression Variability during Bacterial Adaptive Evolution

Keesha E Erickson et al. mSphere. .

Abstract

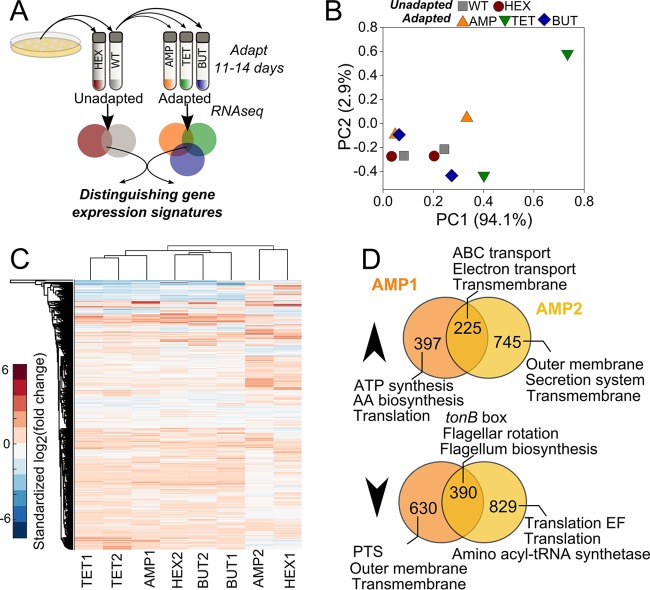
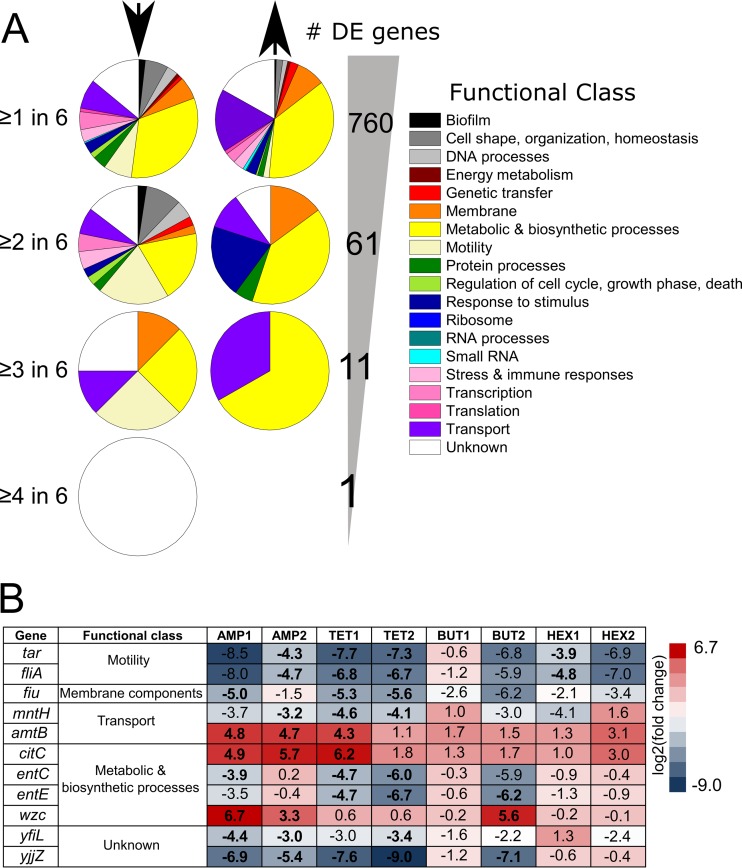
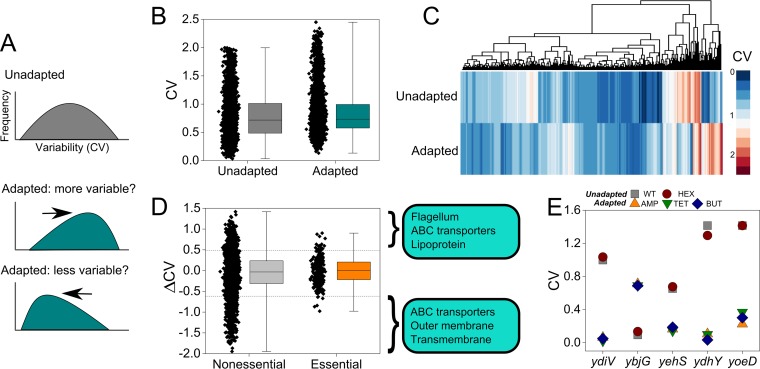
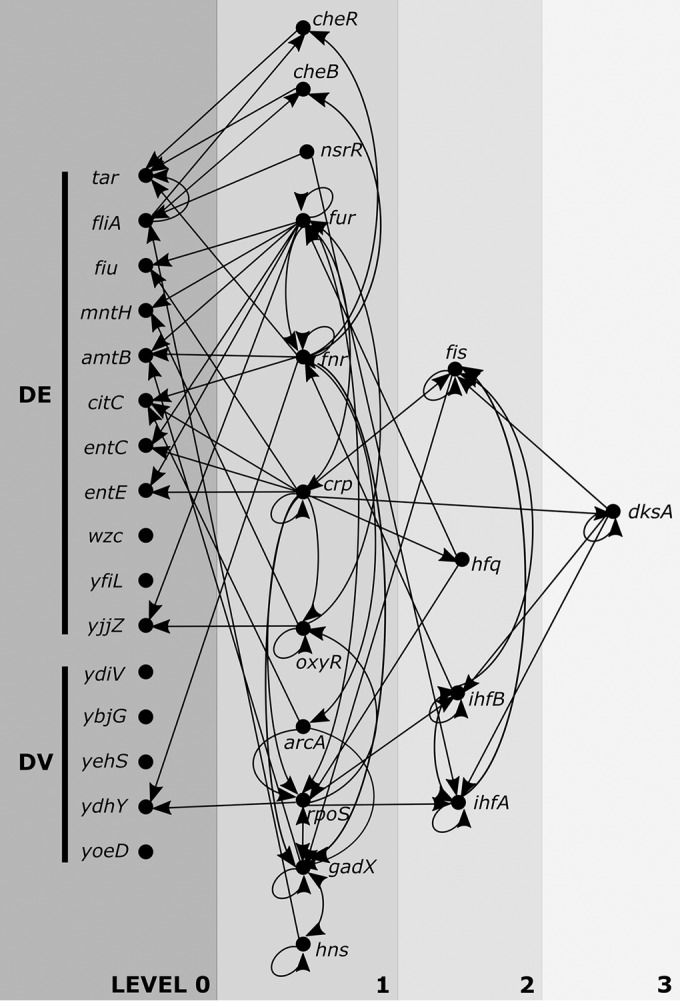
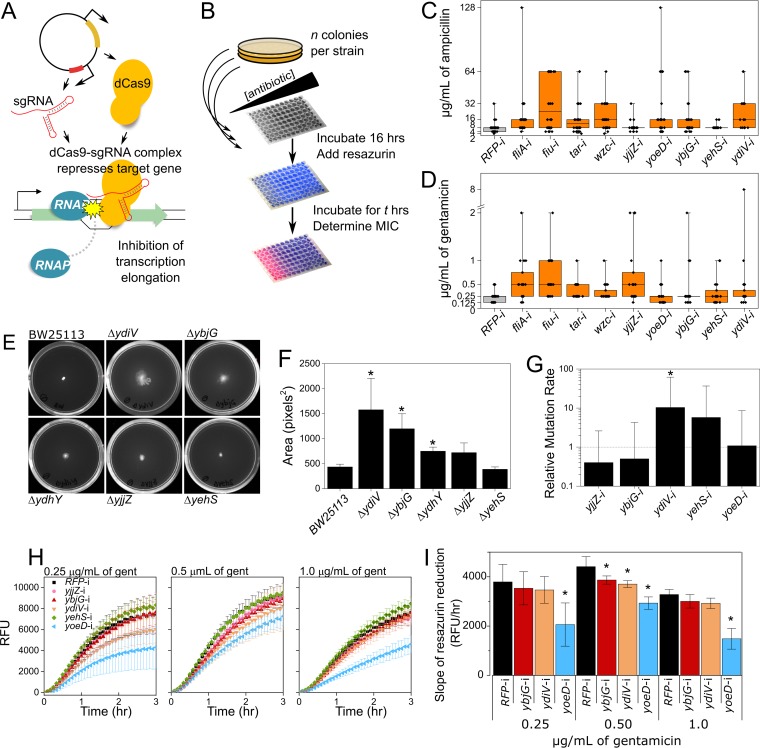
Antibiotic-resistant bacteria are an increasingly serious public health concern, as strains emerge that demonstrate resistance to almost all available treatments. One factor that contributes to the crisis is the adaptive ability of bacteria, which exhibit remarkable phenotypic and gene expression heterogeneity in order to gain a survival advantage in damaging environments. This high degree of variability in gene expression across biological populations makes it a challenging task to identify key regulators of bacterial adaptation. Here, we research the regulation of adaptive resistance by investigating transcriptome profiles of Escherichia coli upon adaptation to disparate toxins, including antibiotics and biofuels. We locate potential target genes via conventional gene expression analysis as well as using a new analysis technique examining differential gene expression variability. By investigating trends across the diverse adaptation conditions, we identify a focused set of genes with conserved behavior, including those involved in cell motility, metabolism, membrane structure, and transport, and several genes of unknown function. To validate the biological relevance of the observed changes, we synthetically perturb gene expression using clustered regularly interspaced short palindromic repeat (CRISPR)-dCas9. Manipulation of select genes in combination with antibiotic treatment promotes adaptive resistance as demonstrated by an increased degree of antibiotic tolerance and heterogeneity in MICs. We study the mechanisms by which identified genes influence adaptation and find that select differentially variable genes have the potential to impact metabolic rates, mutation rates, and motility. Overall, this work provides evidence for a complex nongenetic response, encompassing shifts in gene expression and gene expression variability, which underlies adaptive resistance. IMPORTANCE Even initially sensitive bacteria can rapidly thwart antibiotic treatment through stress response processes known as adaptive resistance. Adaptive resistance fosters transient tolerance increases and the emergence of mutations conferring heritable drug resistance. In order to extend the applicable lifetime of new antibiotics, we must seek to hinder the occurrence of bacterial adaptive resistance; however, the regulation of adaptation is difficult to identify due to immense heterogeneity emerging during evolution. This study specifically seeks to generate heterogeneity by adapting bacteria to different stresses and then examines gene expression trends across the disparate populations in order to pinpoint key genes and pathways associated with adaptive resistance. The targets identified here may eventually inform strategies for impeding adaptive resistance and prolonging the effectiveness of antibiotic treatment.

Keywords: CRISPR-Cas9; adaptive resistance; differential gene expression; gene expression variability; transcriptome.


Figures

FIG 1
FIG 1
Heterogeneity in gene expression upon adaptation. (A) To obtain adapted and unadapted populations, individual wild-type (WT) E. coli K-12 MG1655 colonies were picked from plates and used to inoculate liquid cultures. Wild-type and n-hexane (HEX) samples were harvested after 1 day of growth in M9 minimal medium. Ampicillin (AMP), tetracycline (TET), and n-butanol (BUT) populations were collected after 11 to 14 days of adaptation. (B) Principal-component (PC) analysis of normalized transcript abundance (using FPKM) in the 10 populations (two populations per condition). (C) Heterogeneous gene expression patterns are observable across independent populations. Color indicates gene expression in indicated sample (x axis) with respect to duplicate wild-type populations. Values of log2(fold change) are standardized by sample such that the mean for each sample is 0 and the standard deviation is 1. Clustering is according to Euclidean distance. (D) Similarities and differences between ampicillin-adapted populations 1 and 2. Venn diagrams list the number of genes overexpressed ≥2-fold or underexpressed (indicated by up or down arrowheads, respectively) in each or both populations. The three most enriched gene ontologies are called out for each condition. AA, amino acid; EF, elongation factor; PTS, phosphotransferase.
FIG 2
FIG 2
Intersections in differentially expressed (DE) genes across adapted populations. (A) Gene ontology distribution is shown for genes found to be differentially expressed or overexpressed (indicated by down or up arrows, respectively) in at least one, two, three, or four out of six adapted populations. The total number of genes DE at each level is shown to the right of the pie charts. (B) Summary of the 11 genes that were significantly DE in at least half of the adapted populations. Gene expression values are bold if the gene was significantly differentially expressed (P < 0.05, q < 0.3).
FIG 3
FIG 3
Shifts in gene expression variability are present during bacterial adaptation. (A) Hypothetical distribution in interpopulation gene expression variability. If unadapted samples possess a certain distribution, we predict that shifts in variability will occur in adapted populations. (B) Distribution of variability (CV in FPKM) in gene expression across 4,181 genes in unadapted and adapted samples. For box plots in panels B and D, all data points are shown for each condition. Box plots display the interquartile range and median for the corresponding data. Whiskers on box plots show the minimum and maximum values. (C) Hierarchical clustering by gene expression variability reveals clusters of genes (on vertical axis) with higher and lower variability in unadapted versus adapted bacterial populations. (D) Shifts in gene expression variability in nonessential and essential genes. Shifts are defined as ΔCV = CVunadapted − CVadapted. For ΔCV < 0, the gene has higher expression variability in adapted populations. For ΔCV > 0, the gene has lower variability in adapted populations. The three most enriched gene ontologies are displayed for the 10% of genes with highest and lowest ΔCV (10th and 90th percentiles in ΔCV for all genes are marked with horizontal dashed lines). (E) CV across duplicates for five genes with significantly different expression variability in adapted versus unadapted populations. Abbreviations are as in Fig. 1.
FIG 4
FIG 4
Upstream regulators of target genes. The diagram shows a simplified version of the network regulating target DE and DV genes. Here, only regulators that control two or more of the target genes (in level 0) are shown. Proceeding upstream (moving left to right), only regulators that control two or more of target genes and lower-level genes are included. Arrows indicate the direction of the regulation (i.e., cheR regulates tar).
FIG 5
FIG 5
Synthetic perturbation of DE and DV genes. (A) CRISPR interference (CRISPRi) is used to repress gene expression by blocking progression of RNA polymerase (RNAP) at a site specified by the sequence of the sgRNA. The dCas9 protein and the sgRNA are expressed from a medium-copy-number plasmid. (B) MIC was determined for individual colonies from each CRISPRi strain. Colonies were grown for 16 h in a range of antibiotic concentrations, and MIC was determined visually through a resazurin assay. (C and D) The MICs of ampicillin (C) and gentamicin (D) are shown for individual colonies from each CRISPRi strain. Box plots show the interquartile range. The median is marked with a horizontal line. Whiskers demarcate minimum and maximum values. Individual data points are overlaid on the box plots. n = 19 to 50 colonies per strain. (E) Representative plates from swarming motility assay, for E. coli BW25113 wild-type and five knockout strains after 48 h of growth. (F) Average area from swarming motility assay. Error bars represent the standard deviation across n = 3 replicates per strain. (G) Relative mutation rates for CRISPRi strains (rate of strain/rate of RFP-i control). Error bars represent the standard deviation (n = 30 parallel cultures for each). (H) Resazurin reduction curves. RFU, relative florescence units. Error bars are the standard deviation (n = 4 replicates). gent, gentamicin. (I) Slopes of resazurin reduction curves in panel H. For panels F, G, and I, asterisks indicate a result significantly different from the control (P < 0.05).

References

    1. Review on Antimicrobial Resistance 2014. Antimicrobial resistance: tackling a crisis for the health and wealth of nations. Review on Antimicrobial Resistance, London, United Kingdom.
    1. CDC 2013. Antibiotic resistance threats in the United States, 2013. CDC, U.S. Department of Health and Human Services, Atlanta, GA.
    1. Fernández L, Breidenstein EBM, Hancock REW. 2011. Creeping baselines and adaptive resistance to antibiotics. Drug Resist Updat 14:1–21. doi:10.1016/j.drup.2011.01.001. - DOI - PubMed
    1. Adam M, Murali B, Glenn NO, Potter SS. 2008. Epigenetic inheritance based evolution of antibiotic resistance in bacteria. BMC Evol Biol 8:52. doi:10.1186/1471-2148-8-52. - DOI - PMC - PubMed
    1. Motta SS, Cluzel P, Aldana M. 2015. Adaptive resistance in bacteria requires epigenetic inheritance, genetic noise, and cost of efflux pumps. PLoS One 10:e0118464. doi:10.1371/journal.pone.0118464. - DOI - PMC - PubMed

LinkOut - more resources