Growth references for Tsimane forager-horticulturalists of the Bolivian Amazon
- PMID: 28218400
- PMCID: PMC5321633
- DOI: 10.1002/ajpa.23128
Growth references for Tsimane forager-horticulturalists of the Bolivian Amazon
Abstract
Objectives: Growth standards and references currently used to assess population and individual health are derived primarily from urban populations, including few individuals from indigenous or subsistence groups. Given environmental and genetic differences, growth may vary in these populations. Thus, there is a need to assess whether international standards are appropriate for all populations, and to produce population specific references if growth differs. Here we present and assess growth references for the Tsimane, an indigenous population of Bolivian forager-horticulturalists.
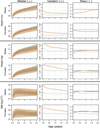
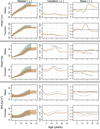
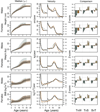
Methods: Mixed cross-sectional/longitudinal anthropometrics (9,614 individuals; 30,118 observations; ages 0-29 years) were used to generate centile curves and Lambda-Mu-Sigma (LMS) tables for height-for-age, weight-for-age, body mass index (BMI)-for-age, and weight-for-height (WFH) using Generalized Additive Models for Location Shape and Scale (GAMLSS). Velocity curves were generated using SuperImposition by Translation and Rotation (SITAR). Tsimane ≤5 years were compared to World Health Organization (WHO) standards while those >5 years were compared to WHO school age references. All ages were compared to published references for Shuar forager-horticulturalists of the Ecuadorian Amazon.
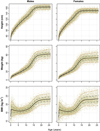
Results: Tsimane growth differs from WHO values in height and weight, but is similar for BMI and WFH. Tsimane growth is characterized by slow height velocity in childhood and early adolescent peak height velocity at 11.3 and 13.2 years for girls and boys. Tsimane growth patterns are similar to Shuar, suggesting shared features of growth among indigenous South Americans.
Conclusions: International references for BMI-for-age and WFH are likely appropriate for Tsimane, but differences in height-for-age and weight-for-age suggest Tsimane specific references may be useful for these measures.
Keywords: Amazonians; BMI; GAMLSS; Tsimane; growth; growth velocity; height; indigenous South Americans; weight.
© 2016 Wiley Periodicals, Inc.
Figures


Similar articles
-
Physical growth of the shuar: Height, Weight, and BMI references for an indigenous amazonian population.Am J Hum Biol. 2016 Jan-Feb;28(1):16-30. doi: 10.1002/ajhb.22747. Epub 2015 Jun 30. Am J Hum Biol. 2016. PMID: 26126793 Free PMC article.
-
Disparities in bone density across contemporary Amazonian forager-horticulturalists: Cross-population comparison of the Tsimane and Shuar.Am J Phys Anthropol. 2020 Jan;171(1):50-64. doi: 10.1002/ajpa.23949. Epub 2019 Oct 29. Am J Phys Anthropol. 2020. PMID: 31663132
-
Growth curves and the international standard: How children's growth reflects challenging conditions in rural Timor-Leste.Am J Phys Anthropol. 2018 Feb;165(2):286-298. doi: 10.1002/ajpa.23350. Epub 2017 Oct 27. Am J Phys Anthropol. 2018. PMID: 29076525
-
[WHO growth standards for infants and young children].Arch Pediatr. 2009 Jan;16(1):47-53. doi: 10.1016/j.arcped.2008.10.010. Epub 2008 Nov 25. Arch Pediatr. 2009. PMID: 19036567 Review. French.
-
New approaches to obtaining individual peak height velocity and age at peak height velocity from the SITAR model.Comput Methods Programs Biomed. 2018 Sep;163:79-85. doi: 10.1016/j.cmpb.2018.05.030. Epub 2018 Jun 1. Comput Methods Programs Biomed. 2018. PMID: 30119859 Review.
Cited by
-
Relationship of sanitation, water boiling, and mosquito nets to health biomarkers in a rural subsistence population.Am J Hum Biol. 2020 Jan;32(1):e23356. doi: 10.1002/ajhb.23356. Epub 2019 Dec 10. Am J Hum Biol. 2020. PMID: 31821682 Free PMC article.
-
Comparison of Anthropometric Indicators That Assess Nutritional Status From Infancy to Old Age and Proposal of Percentiles for a Regional Sample of Chile.Front Nutr. 2021 Dec 24;8:657491. doi: 10.3389/fnut.2021.657491. eCollection 2021. Front Nutr. 2021. PMID: 35004795 Free PMC article.
-
Immune function during pregnancy varies between ecologically distinct populations.Evol Med Public Health. 2020 Jul 3;2020(1):114-128. doi: 10.1093/emph/eoaa022. eCollection 2020. Evol Med Public Health. 2020. PMID: 32983537 Free PMC article.
-
Differences in Tsimane children's growth outcomes and associated determinants as estimated by WHO standards vs. within-population references.PLoS One. 2019 Apr 17;14(4):e0214965. doi: 10.1371/journal.pone.0214965. eCollection 2019. PLoS One. 2019. PMID: 30995260 Free PMC article. Clinical Trial.
-
The Tsimane Health and Life History Project: Integrating anthropology and biomedicine.Evol Anthropol. 2017 Apr;26(2):54-73. doi: 10.1002/evan.21515. Evol Anthropol. 2017. PMID: 28429567 Free PMC article.
References
-
- Becker NSA, Verdu P, Froment A, Le Bomin S, Pagezy H, Bahuchet S, Heyer E. Indirect evidence for the genetic determination of short stature in African Pygmies. Am J Phys Anthropol. 2011;145:390–401. - PubMed
-
- Bert F, Corella A, Gene M, Perez-Perez A, Turbon D2015. Major Mitochondrial DNA Haplotype Heterogeneity in Highland and Lowland Amerindian Populations from Boliviav. 77:45–60. - PubMed
MeSH terms
Grants and funding
LinkOut - more resources
Full Text Sources
Other Literature Sources
Medical
Research Materials

