. 2017 May;38(5):2599-2615.
doi: 10.1002/hbm.23545. Epub 2017 Feb 20.

Development of cortical motor circuits between childhood and adulthood: A navigated TMS-HdEEG study

Affiliations

Development of cortical motor circuits between childhood and adulthood: A navigated TMS-HdEEG study

Sara Määttä et al. Hum Brain Mapp. 2017 May.

Abstract

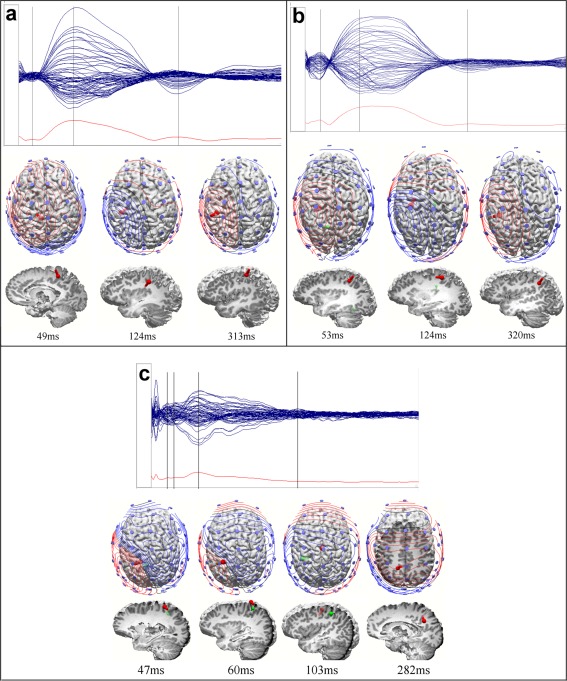
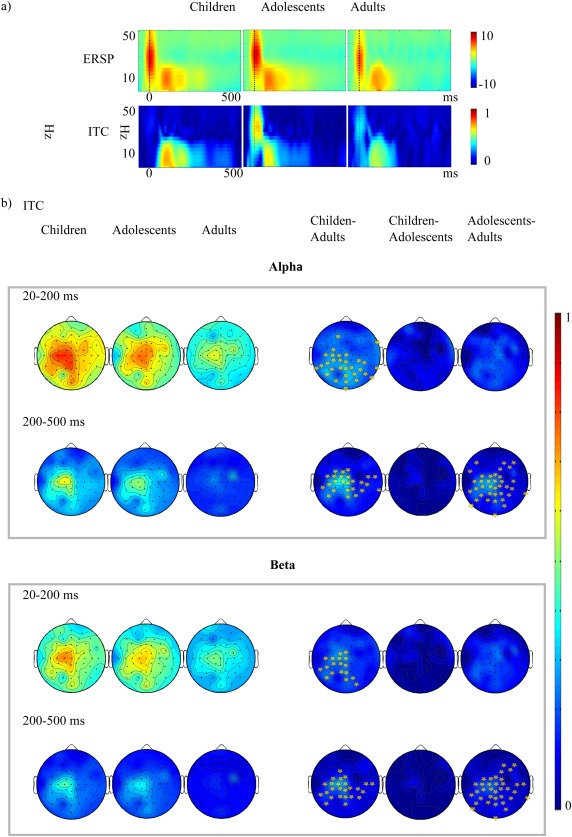
Motor functions improve during childhood and adolescence, but little is still known about the development of cortical motor circuits during early life. To elucidate the neurophysiological hallmarks of motor cortex development, we investigated the differences in motor cortical excitability and connectivity between healthy children, adolescents, and adults by means of navigated suprathreshold motor cortex transcranial magnetic stimulation (TMS) combined with high-density electroencephalography (EEG). We demonstrated that with development, the excitability of the motor system increases, the TMS-evoked EEG waveform increases in complexity, the magnitude of induced activation decreases, and signal spreading increases. Furthermore, the phase of the oscillatory response to TMS becomes less consistent with age. These changes parallel an improvement in manual dexterity and may reflect developmental changes in functional connectivity. Hum Brain Mapp 38:2599-2615, 2017. © 2017 Wiley Periodicals, Inc.

Keywords: adolescent; adult; child; electroencephalography; gamma-Amicobutyric Acid; motor cortex; transcranial magnetic stimulation.


Figures

Figure 1
Figure 1
60 EEG channels were used in the analyses when exploring the topography of the TEP peaks. The channels were divided into fifteen regions according to their anteroposterior (AP; 1 = frontal, 2 = central and 3 = parieto‐occipital) and mediolateral (ML; 1 = left lateral, 2 = left mediolateral, 3 = medial, 4 = right mediolateral, 5 = right lateral) location.
Figure 2
Figure 2
Correlation between the Box and Block test and MT (a) and Box and Block test and GMFP area (b). Better Box and Block test score is associated with lower MT and smaller GMFP. The difference between the age groups is also clearly seen.
Figure 3
Figure 3
TMS‐evoked electrical activity presented as GMFP in children, adolescents, and adults. Statistically significant differences between groups are presented in the lower panel in grey.
Figure 4
Figure 4
Grand average of the EEG responses and the topography of the TEP peaks presented as scalp distribution maps in children, adolescents, and adults using recording (forehead) reference. Zero corresponds to the TMS pulse. (a) Topography of the TEP peaks in children 51, 127, and 307, and in adolescents 50, 129, and 305 ms after 110%MT motor cortex stimulation. (b) Topography of the TEP peaks in adults 34, 43, 51, 117, 190, and 257 ms after 110%MT motor cortex stimulation.
Figure 5
Figure 5
Dipole localization using average reference was conducted in order to approximate the number and site of sources accounting for TEP components. In upper panel, grand average of the EEG responses presented as butterfly plots and GMFP in time window 0–500 ms. Zero corresponds to the TMS pulse. Lower panel visualizes dipoles from top and left view of the brain. Also potential maps and electrode location are shown in top view. All voltage scales are optimized for each group and component. (a) TEP peaks in children 49 (P50), 124 (N100), and 313 (P300) ms after 110%MT motor cortex stimulation. (b) TEP peaks in adolescents 53 (P50), 124 (N100), and 320 (P300) ms after 110%MT motor cortex stimulation. (c) TEP peaks in adults 47 (N45), 60 (P50), 103 (N100), and 282 (N280) ms after 110%MT motor cortex stimulation
Figure 6
Figure 6
(a) The group‐wise ERSP (above) and ITC (below) values averaged from all channels. Zero corresponds to the TMS pulse. (b) ITC topography in alpha (8–15 Hz) and (beta 15–25) Hz range. In the right column the difference between the ITC distributions is shown (children minus adults, children minus adolescents and adolescents minus adults). The light dots represent the scalp positions where ITC is significantly increased in children and adolescents compared with adults.

References

    1. Awiszus F (2003): TMS and threshold hunting. Clin Neurophysiol Suppl 56:13–23. - PubMed
    1. Awiszus F (2012): On relative frequency estimation of transcranial magnetic stimulation motor threshold. Clin Neurophysiol 123:2319–2320. - PubMed
    1. Barnea‐Goraly N, Kwon H, Menon V, Eliez S, Lotspeich L, Reiss AL (2004): White matter structure in autism: Preliminary evidence from diffusion tensor imaging. Biol Psychiatry 55:323–326. - PubMed
    1. Bartzokis G, Beckson M, Lu PH, Nuechterlein KH, Edwards N, Mintz J (2001): Age‐related changes in frontal and temporal lobe volumes in men: A magnetic resonance imaging study. Arch Gen Psychiatry 58:461–465. - PubMed
    1. Battino D, Estienne M, Avanzini G (1995): Clinical pharmacokinetics of antiepileptic drugs in paediatric patients. Part II. Phenytoin, carbamazepine, sulthiame, lamotrigine, vigabatrin, oxcarbazepine and felbamate. Clin Pharmacokinet 29:341–369. - PubMed

Publication types